

You want to know all the hot and important updates of the world, but at the same time, you do not want to miss out on your favourite celebrities on social media. But how to do both at one time? Let us go to Twitter or “X”. It’s a combo of entertainment and news. But that is not only it, there are many interesting facts and stats about X that you would be amazed by. Let us cover all the interesting “X” (Twitter) statistics 2025 one by one.
Although Twitter’s name has changed to “X”, most of the users worldwide call it by its old name. Twitter has influenced the world for 11 years, and it will also continue its reign in the future.
Spending 6 hours writing posts that get zero traction?
Paste your URL. ZuAI turns it into 30 brand-on captions in 10 minutes — no blank-page panic, no generic AI filler.
How did Twitter start?
- Do you feel that for small things, it is better to text rather than call? Back in 2006, a NYU student, Jack Dorsey, also thought the same and built a network system called “twttr.”
- He used to work at Odeo, and “twttr” was only available to Odeo. But in July 15, 2006. It was introduced to the public.
- The website saw huge traffic and garnered the interest of the country. Let us see its growth.
| Year / Period | Tweets per Day | Notes |
|---|---|---|
| Early launch | ~20,000 | In the first few months after launch. |
| 2007 | ~60,000 | Boosted by popularity at the SXSW conference. |
| 2008 | ~300,000 | Continued steady growth. |
| Early 2010 | ~50,000,000 | Massive global adoption. |
- Did you know that “Hashtags” were brought to us by X (Twitter)? In 2007, Chris Messina, a writer, introduced Hashtags on TwitterSoon, businesses and TV shows started using Hashtags, and encouraged the use of hashtags to get popularity.
- The growth of Twitter continued, and the events followed like this.
| Year | Event | Details |
|---|---|---|
| 2013 | Twitter went public | Continued to expand as a publicly traded company. |
| 2022 | Elon Musk acquired Twitter for $44 billion, took it private, and rebranded it to X | Major rebranding and shift in company direction. |
Get 30 days of social content from your website — in 10 minutes.
How many people use Twitter? Let us see Twitter statistics
- Approximately 500 million people use Twitter monthly
- It is among the top 6 social networking apps in the United States
X (Twitter) Statistics for USA
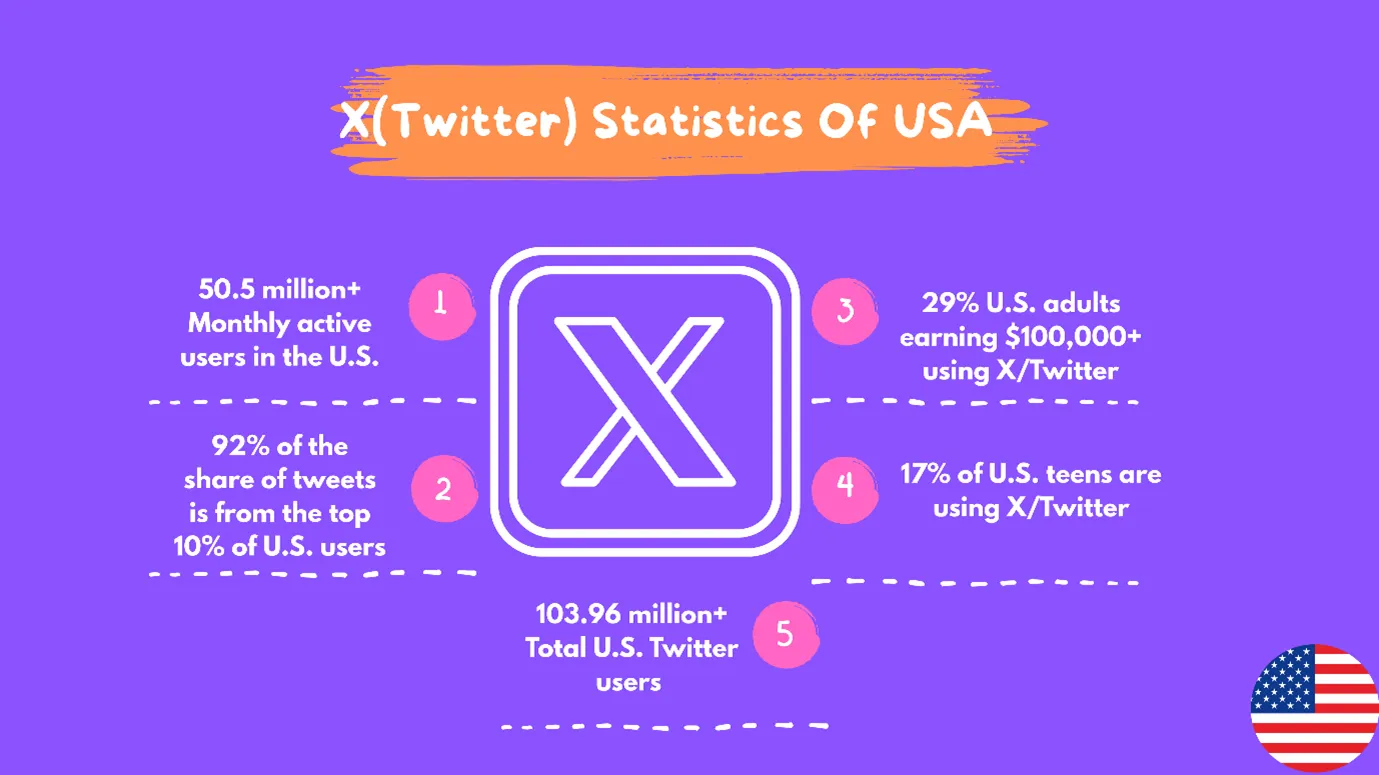
- Approximately 1 in 5 X users are American.
- The USA is the Key market of X (Twitter). Here is the table showing why:
| Statistic | Value / Insight |
|---|---|
| Monthly active users in the U.S. | 50.5 million+ |
| Total U.S. Twitter users (as of Feb 2025) | 103.96 million+ |
| Share of tweets from the top 10% of U.S. users | 92% |
| U.S. share of global Twitter user base | 14% |
| U.S. adults using X/Twitter | 22% |
| U.S. adults earning $100,000+ using X/Twitter | 29% |
| U.S. teens using X/Twitter | 17% |
From this table, you can understand that Twitter is very popular among the USA teens and the affluent.
X (Twitter) Statistics Worldwide

- Let us see how X (Twitter) is popular among its users
| Metric | Value |
|---|---|
| Monthly Active Users (MAUs) — as of Feb 2025 | 586 million+ |
| Daily Active Users (DAUs) — according to X | 200–250 million |
| DAUs — Apptopia analysis (lower bound) | ~121 million |
| Average app opens per user (monthly) | 120.4 times |
| Average monthly time spent | 3.7 hours |
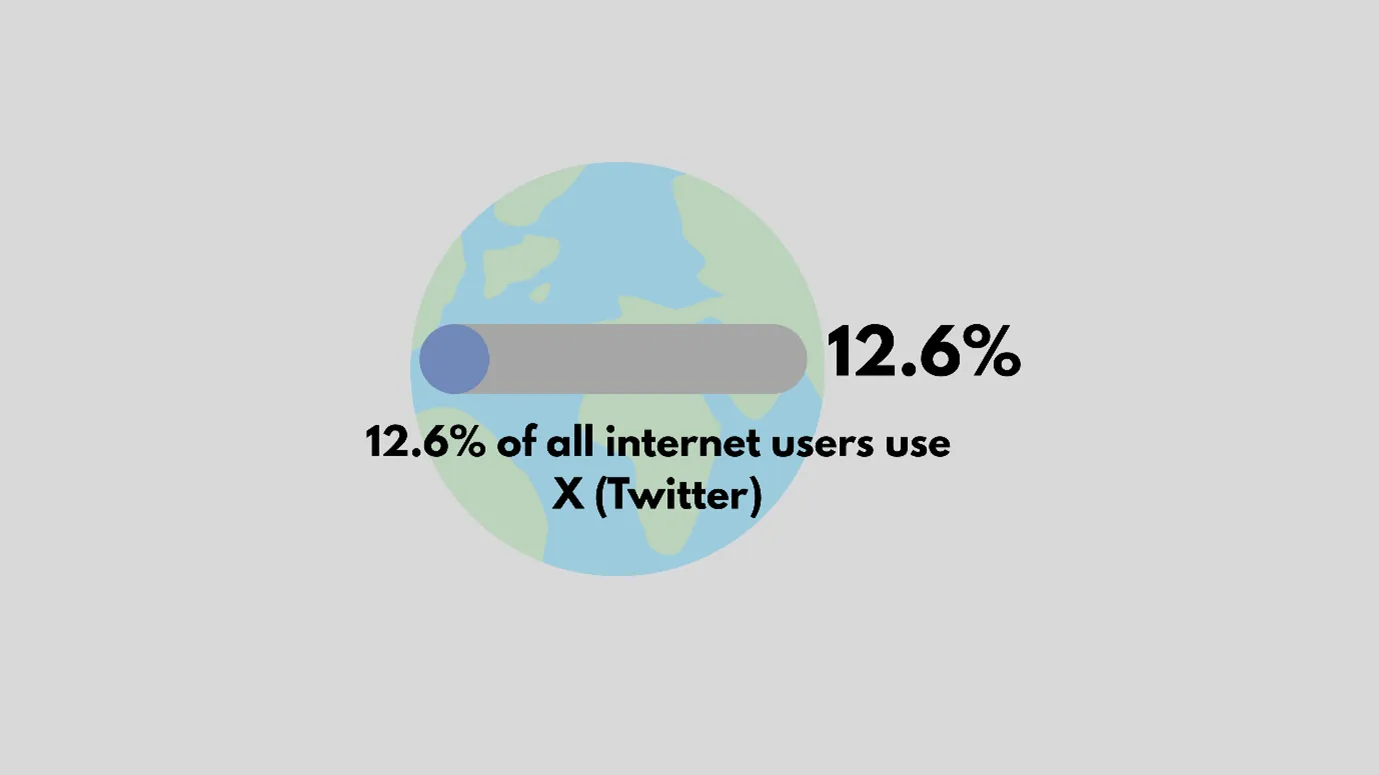
| Worldwide Twitter users | 12.6% of all internet users |
| Daily usage rank (global) | 7th most-used social network |
| Global popularity rank | 12th most popular social platform |
10,000+ brands grew faster with one tool.
X (Twitter) Statistics: Monthly sign-ups, group joining, spaces joining, audience type, and tweets
This table shows the Audience types of Twitter
- Table 2A: X/Twitter User Demographics – Parents, Students, Teens
| Group | Insight |
|---|---|
| Parents | 39% of parents use X/Twitter |
| Students | 1.5× more monthly active users than other platforms |
| U.S. Teens | 17% of U.S. teens use X/Twitter |
- Twitter is popular among the UK audience. The table below shows interest in the UK
|
United Kingdom |
93% population is aware of X/Twitter |
|
United Kingdom |
23 million+ residents on X/Twitter |
- So many people post about their pets on Twitter. The table below shows Twitter usage statistics, on Audience interest in pets.
| Interest Category | Users Interested (Millions) |
|---|---|
| Dogs | 235 |
| Cats | 41.6 |
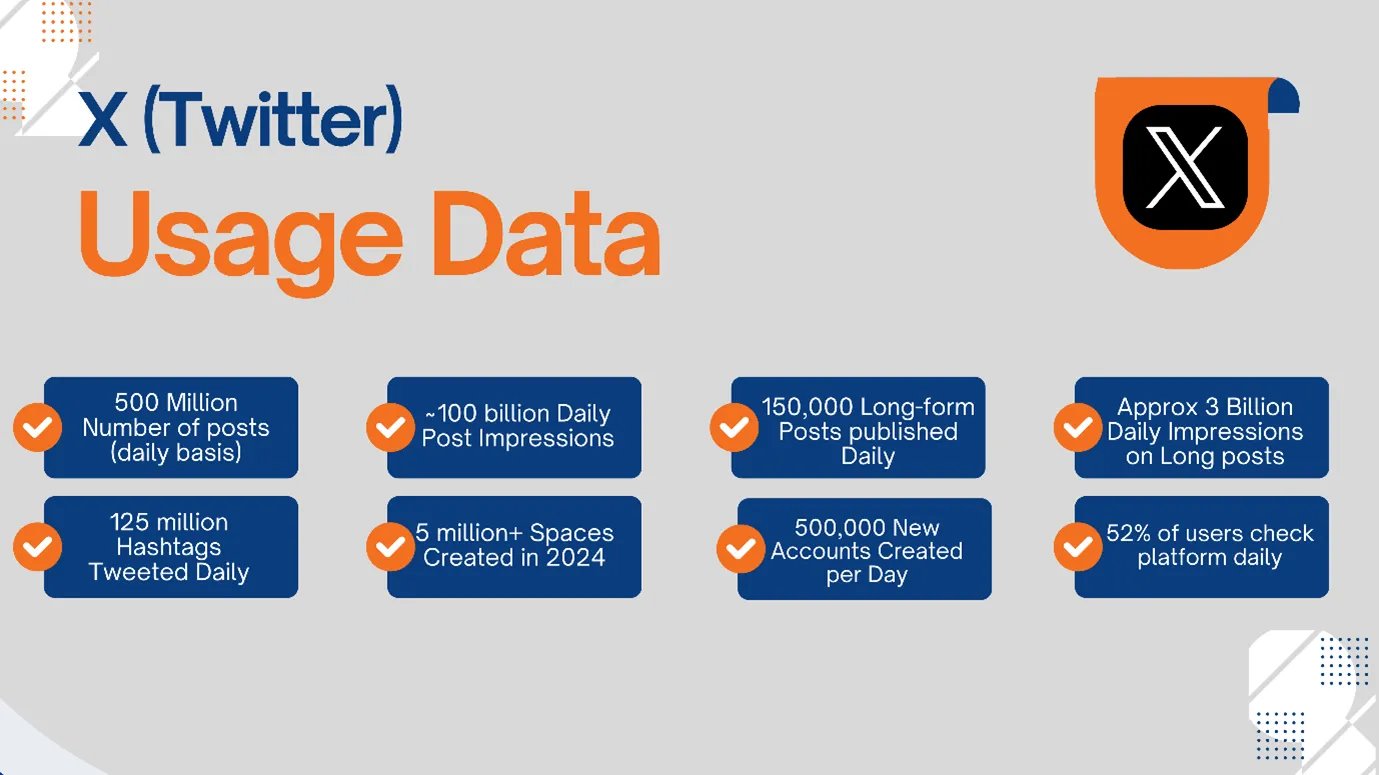
- There are so many tweets, posts, and activities happening on Twitter daily. This table shows Twitter usage statistics on Audience activity
| Metric / Activity | Value |
|---|---|
| Number of posts (daily) | 500 million |
| Daily post impressions | ~100 billion |
| Long-form posts published daily | 150,000 |
| Daily impressions on long-form posts | ~3 billion |
| Hashtags tweeted daily | 125 million |
| Spaces created in 2024 | 5 million+ |
| Daily community joins | 70,000 |
| New signups per day | 1.5 million |
| New accounts created per day | 500,000 |
| Monthly platform check-ins | 96% of users |
| Weekly platform check-ins | 84% of users |
| Daily platform check-ins | 52% of users |
- Twitter audience growth over the years
| Date | Daily Active Users (Millions) |
|---|---|
| Q1 2017 | 109 |
| Q2 2017 | 110 |
| Q3 2017 | 114 |
| Q4 2017 | 115 |
| Q1 2018 | 120 |
| Q2 2018 | 122 |
| Q3 2018 | 124 |
| Q4 2018 | 126 |
| Q1 2019 | 134 |
| Q2 2019 | 139 |
| Q3 2019 | 145 |
| Q4 2019 | 152 |
| Q1 2020 | 166 |
| Q2 2020 | 186 |
| Q3 2020 | 187 |
| Q4 2020 | 192 |
| Q1 2021 | 199 |
| Q2 2021 | 206 |
| Q3 2021 | 211 |
| Q4 2021 | 217 |
| Q1 2022 | 229 |
| Q2 2022 | 237.8 |
| October 2022* | 257.8 |
| November 2022* | 259.4 |
| September 2023* | 225–245 |
- Twitter has approximately 951 million unique visitors per month, down 2.11% from January 2025.
- In February 2025, there were over 900 million unique X visitors.
- Twitter content creation and posting frequency activity by audience
- Twitter audience overlap with other platforms
| Platform | % of X Users Also Using It |
|---|---|
| 88.1% | |
| 81.2% | |
| YouTube | 80.8% |
| Discord | 69.3% |
| 66.4% |
- There were 640k X Premium subscribers. (In the beginning of 2025). They spend 3x longer time on the X/Twitter platform than other users
See what ZuAI generates from your website — right now.
Paste your URL. Watch ZuAI write a month of brand-on captions in seconds. Preview before you create an account.
X(Twitter) Statistics on traffic. From where does Twitter get its traffic?
- From where does Twitter get its traffic? Let us see Twitter statistics 2025.
| Metric / Segment | Value | Notes |
|---|---|---|
| Total Visits (Feb 2025) | 4.83 billion | Increased from 4.78B the previous month |
| Total Visits (Previous Record) | ~0.5 billion | 87% of these were on mobile |
| Hits from Direct Traffic | 3.57 billion | Out of total recorded visits |
| Direct Traffic Share | 74% | Accounts for the majority of visits |
- X (Twitter) gets more mobile device visits. This table shows the data of mobile visits and desktop visits
| Mobile Visits (Volume) | 2.67 billion | Total visits via mobile devices |
| Mobile Visits (Share) | 55.36% | Indicates mobile-dominant usage |
| Desktop Visits (Volume) | 2.16 billion | Visits from non-mobile devices |
| Desktop Visits (Share) | 44.64% | Secondary to mobile |
One coffee from URL to a full month of scheduled posts.
Drop your URL, brew your coffee, come back to 30 brand-on captions ready to publish.
X (Twitter) Statistics: Regional User Distribution
- Here is the region-wise distribution of Twitter
| Region | Active Users | % of Global Total |
|---|---|---|
| Northern America | 115 million | 19.6% |
| Eastern Asia | 102 million | 17.4% |
| South-Eastern Asia | 73.5 million | 12.5% |
| Western Europe | 52.2 million | 8.9% |
| Western Asia | 50.0 million | 8.5% |
| Southern America | 39.1 million | 6.7% |
| Northern Europe | 33.0 million | 5.6% |
| Southern Asia | 29.0 million | 4.9% |
| Central America | 20.3 million | 3.5% |
| Southern Europe | 21.8 million | 3.7% |
| Eastern Europe | 12.9 million | 2.2% |
| Western Africa | 9.85 million | 1.7% |
| Northern Africa | 8.40 million | 1.4% |
| Oceania | 6.29 million | 1.1% |
| Eastern Africa | 5.57 million | 1.0% |
| Southern Africa | 3.37 million | 0.6% |
| Caribbean | 2.51 million | 0.4% |
| Central Asia | 781 thousand | 0.1% |
| Middle Africa | 658 thousand | 0.1% |
Spending 6 hours writing posts that get zero traction?
Paste your URL. ZuAI turns it into 30 brand-on captions in 10 minutes — no blank-page panic, no generic AI filler.
(X) Twitter statistics: How much time is spent on Twitter?
- An 18+ user in the US spends 34.1 minutes per day on X/Twitter.
Time spent on (X)Twitter by other countries.
- This is how people of other countries spend time on Twitter
| Country | App Opens per User (Monthly, times) |
|---|---|
| Japan | 211.1 |
| Indonesia | 194.5 |
| Finland | 181.2 |
Get 30 days of social content from your website — in 10 minutes.
(X) Twitter usage statistics: Age and Gender Statistics
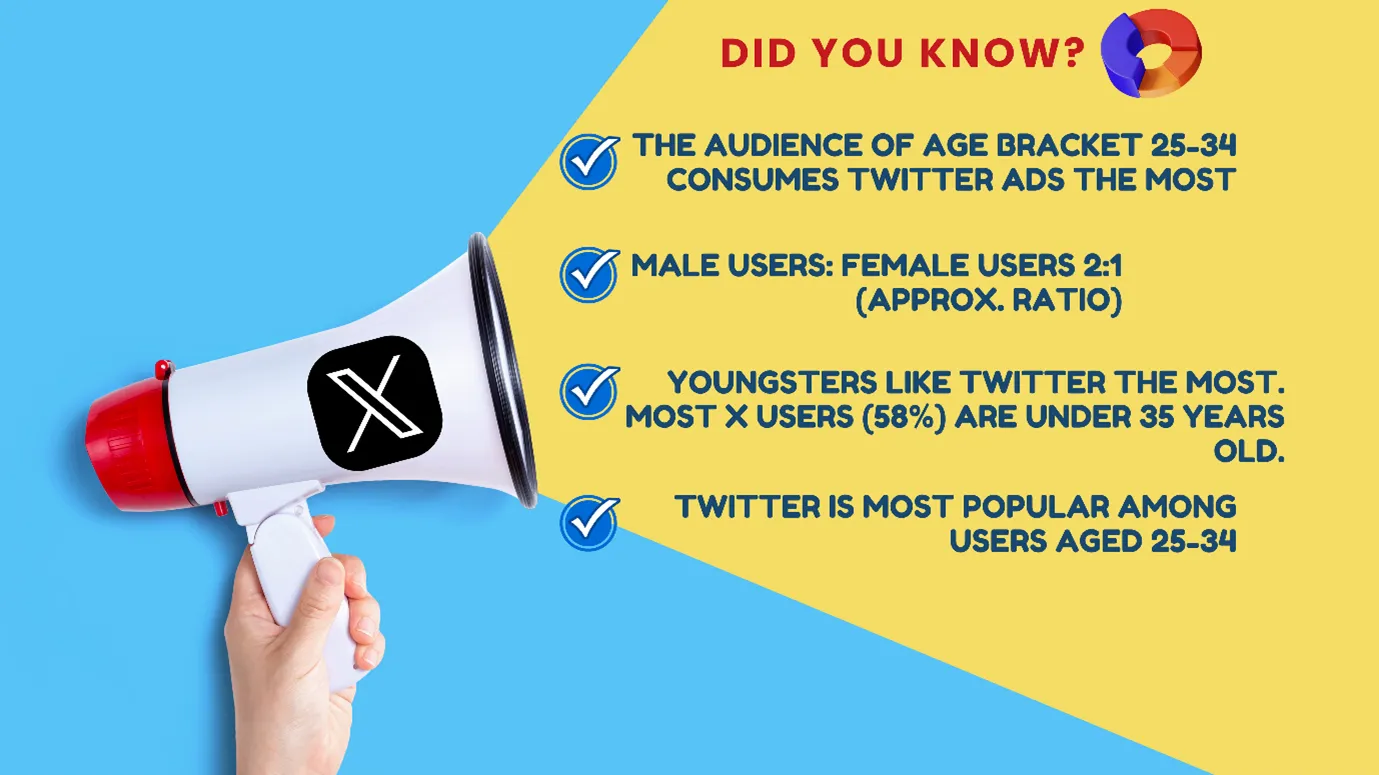
- Twitter is more popular among Men.
| Male users: Female users | 2:1 (approx. ratio) |
- Twitter is most popular among users aged 25-34
| Age Group | Share |
|---|---|
| 18–24 | 28.8% |
| 25–34 | 29.58% |
| 35–44 | 17.88% |
| 45–54 | 11.47% |
| 55–64 | 7.54% |
| 65+ | 4.83% |
- Youngsters like Twitter the most. Most X users (58%) are under 35 years old.
Here is a table showing how people of different age group think of Twitter
| Opinion of X | 18–34 | 35–44 | 45–64 | 65+ |
|---|---|---|---|---|
| Very Favorable | 16% | 11% | 6% | 3% |
| Somewhat Favorable | 25% | 27% | 25% | 21% |
| Somewhat Unfavorable | 19% | 26% | 23% | 19% |
| Very Unfavorable | 17% | 13% | 19% | 22% |
| Heard of, No Opinion | 19% | 21% | 26% | 31% |
| Never Heard of | 4% | 2% | 2% | 4% |
- For teens, Twitter is the 6th most popular platform. This table shows the ranking according to popularity among Teens.
1. YouTube
2. TikTok
3. Instagram
4. Snapchat
5. Facebook
6. Twitter
10,000+ brands grew faster with one tool.
Twitter statistics country-wise.
- Here is the table showing the top countries where people use Twitter the most.
| Country | Users (Millions) |
|---|---|
| United States | 103.96 |
| Japan | 74.10 |
| India | 30.30 |
| Indonesia | 27.05 |
| United Kingdom | 24.30 |
| Thailand | 16.20 |
| France | 16.10 |
| Germany | 15.55 |
| Spain | 12.85 |
| Philippines | 12.20 |
| Canada | 11.80 |
- These five countries together account for 46.88% of the global user base.
1. Country
2. United States
3. Japan
4. India
5. South Korea
6. Brazil
See what ZuAI generates from your website — right now.
Paste your URL. Watch ZuAI write a month of brand-on captions in seconds. Preview before you create an account.
X (Twitter) User Statistics by Purpose of Use
- Being up-to-date with the current news is the most popular reason for visiting X. Here is the table showing all purposes of using Twitter
| Activity | Share of Respondents |
|---|---|
| Keep up to date with news and current events | 60.6% |
| Follow or research brands and products | 34.9% |
| Look for funny or entertaining content | 34.8% |
| Post or share photos or videos | 27% |
| Message friends and family | 19.2% |
- 57% of those who consume news via X claim that it has increased their understanding of current events. (Pew Research)
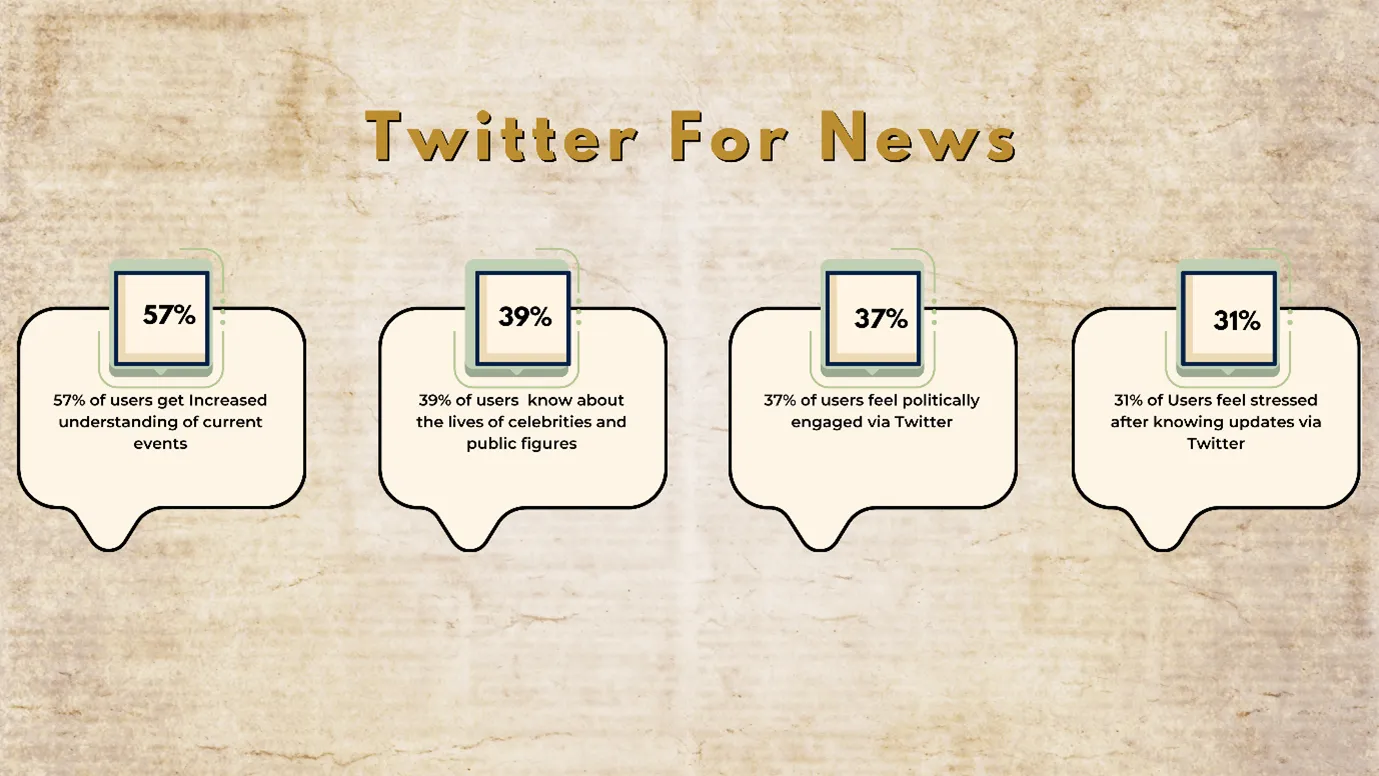
There are also other ways how Twitter impacts other’s life.
| Impact | Get News on X | Don’t Get News on X |
|---|---|---|
| Increased understanding of current events | 57% | 23% |
| Increased how much they know about the lives of celebrities and public figures | 39% | 22% |
| Increased how politically engaged they feel | 37% | 15% |
| Increased their stress level | 31% | 14% |
- There are also other reasons for using Twitter
| To follow brands |
| To strengthen their professional networks, |
- 59% of U.S. X/Twitter users say they use the platform to keep up with politics.
One coffee from URL to a full month of scheduled posts.
Drop your URL, brew your coffee, come back to 30 brand-on captions ready to publish.
X( Twitter) statistics: How Users Engage on X (Twitter)?
- The median engagement rate is 0.015 % on Twitter
| Metric | Value |
|---|---|
| Median Engagement Rate | 0.015% |
| Median Number of Tweets per Week | 2.16 tweets |
- Almost 50% of interactions come from retweets.
- 125 million Hashtags are used every day on Twitter
- Videos are more popular on Twitter. This table shows the data.
| Metric / Insight | Value / Detail |
|---|---|
| Daily Vertical Video Viewers | 100 million+ users |
| Average Time Spent Watching Vertical Videos | 13+ minutes per day |
| Growth in Video Views Since 2023 | 30% increase |
| Gen Z Share of Vertical Video Audience | Over 50% |
- Emojis are used widely on Twitter. ‘😂’ emoji has been used the most, with over 3.8 billion uses
Here’s a list of the most popular emojis used on X:
|
Rank |
Emoji |
Number of Uses |
| 1 | 😂 |
3.84 billion |
| 2 | ❤️ |
2.05 billion |
| 3 | 😭 |
1.75 billion |
| 4 | 😍 |
1.36 billion |
| 5 | ♻️ |
0.99 billion |
| 6 | ♥️ |
0.9 billion |
| 7 | 😊 |
0.84 billion |
| 8 | 😔 |
0.63 billion |
| 9 | 💕 |
0.63 billion |
| 10 | 😘 |
0.61 billion |
Spending 6 hours writing posts that get zero traction?
Paste your URL. ZuAI turns it into 30 brand-on captions in 10 minutes — no blank-page panic, no generic AI filler.
X (Twitter) Statistics on Revenue Generation
- Twitter receives its major chunk of revenue by Ad runs. Here is a table showing Advertisement revenue
| Year | Advertising Revenue (USD, billions) |
|---|---|
| 2021 | 4.46 |
| 2022 | 4.14 |
| 2023 | 2.98 |
- Users spend 26% more time viewing ads on Twitter than on any other social media platform, as they find Twitter more genuine.
- The revenue of Twitter Ad run has seen a decline from past years.
| Metric | Value / Insight |
|---|---|
| Total Revenue | $2.5 billion |
| Year-on-Year Revenue Change | ↓ 13.7% decline |
| Revenue from Advertising | 68% of total revenue |
Get 30 days of social content from your website — in 10 minutes.
X (Twitter) statistics on Number of Employees
- The number of employees on Twitter has reduced to a huge number.
X/Twitter Workforce Comparison (2021 vs 2025)
| Period | Number of Full-Time Employees | Notes |
|---|---|---|
| December 2021 (Pre-acquisition) | 7,500 | Before Elon Musk’s acquisition. |
| 2025 (Current) | ~1,000 | Post-acquisition under Elon Musk. |
10,000+ brands grew faster with one tool.
X (Twitter) statistics by Business presence
- As you already know by now, most people use Twitter for news updates. So, all media houses are present on Twitter.
| 1. Media companies |
| 2. Sports companies |
- They also post several times a week to stay relevant on Twitter.
| Account Type | Median Tweets per Week |
|---|---|
| Media Companies | 49.90 |
| Sports Teams | 44.25 |
See what ZuAI generates from your website — right now.
Paste your URL. Watch ZuAI write a month of brand-on captions in seconds. Preview before you create an account.
X(Twitter) statistics by Ad run
- Companies like running ads on Twitter. The site’s brand safety score exceeds 99%.
- People respond well to Twitter ads.
The table below shows the data
X/Twitter Advertising Insights (2024–2025)
| Metric / Insight | Value / Detail |
|---|---|
| Advertisers returned recently | 1,700+ |
| Return of top ad spenders | 90 of the top 100 from previous year |
| Ad engagement trend | Increased in 2024 |
- Twitter Ad click-through rate is 0.5% / 1000 impressions
- Twitter Ads have performed better in 2025.
The table below shows the data
| Metric / Insight | Value / Detail |
|---|---|
| Total Ad Reach | 586 million users |
| Global Population Reach | 7.1% of all people on Earth |
| Projected U.S. Ad Revenue Growth (2025) | ↑ 17.5% |
| Projected U.S. Ad Revenue (2025) | $1.31 billion |
| Projected Rise in Sales | 16.5% |
- The major Ad revenue of Twitter comes from the USA.
U.S. Contribution to X/Twitter (2025)
| Metric | Value |
|---|---|
| Share of Global User Base | 14% |
| Share of Total Revenue | Over 50% |
The USA contributes a lot to Twitter’s ad revenue.
Twitter revenue by region 2018 to 2024 ($bn)
| Year | United States | Rest of World |
|---|---|---|
| 2018 | 1.6 | 1.4 |
| 2019 | 1.9 | 1.5 |
| 2020 | 2 | 1.6 |
| 2021 | 2.8 | 2.2 |
| 2022 | 2.4 | 2 |
| 2023 | 1.6 | 1.4 |
| 2024 | 1.3 | 1.2 |
- The audience of age bracket 25-34 consumes Twitter ads the most. Here is the table showing the demographics of the Twitter Ad audience.
X: Advertising Audience Profile by Age & Gender (Feb 2025)
| Age Group | Female Share | Male Share |
|---|---|---|
| 13–17 years old | 1.0% | 1.0% |
| 18–24 years old | 13.2% | 18.9% |
| 25–34 years old | 13.0% | 24.5% |
| 35–49 years old | 6.9% | 14.2% |
| 50+ years old | 2.5% | 4.8% |
One coffee from URL to a full month of scheduled posts.
Drop your URL, brew your coffee, come back to 30 brand-on captions ready to publish.
Power of Twitter marketing: X (Twitter) statistics on marketing.
- Twitter is the Number one platform for discoverability (for any brand)
On Twitter, people come for both education and entertainment. Here is the table showing people’s responses to a brand on Twitter.
X Platform User Behavior and Preferences
| Metric / Insight | Value / Detail |
|---|---|
| People engaging with a brand’s content daily on Twitter | 35% |
| People who have engaged with a brand | 75% |
| Likelihood of making an in-app purchase | 2× more likely |
| Likelihood to be early adopters (try new things first) | 36% more likely |
| Users researching brands and products on X | 37.8% |
| People interacting with or taking an interest in a brand on Twitter | 79% |
- Many Twitter users prefer getting services from a brand on the platform.
| Users reaching out for customer care via X |
53% |
| Preference for messaging over calling businesses |
64% of users |
| Expected response time from businesses |
Three hours or less |
- Twitter gives good engagement to brands.
Here is a table showing the engagement metrics on Twitter.
X (Twitter) Engagement and Posting Insights
| Metric / Insight | Value / Detail |
|---|---|
| X/Twitter posts per week (high-volume usage) | 61 posts per week |
| Impressions per post (high-volume usage) | Up to 2,121 impressions per post |
| Optimum number of posts per week for minimum engagement | 6 |
| Average organic engagement rate (Entertainment & Media) | 1.7% |
| Overall engagement rate across all industries | 2% |
| Lowest engagement rate (Consumer Goods, Marketing Agencies, Real Estate) | 0.9% |
| Engagement rate for top brands | 0.08% |
| Average engagement rate per tweet | 0.029% |
| Posting frequency for top brands | 4.2× per week |
- From the above table you can see that brands are active on Twitter.
The table below shows how brands that leverage Twitter
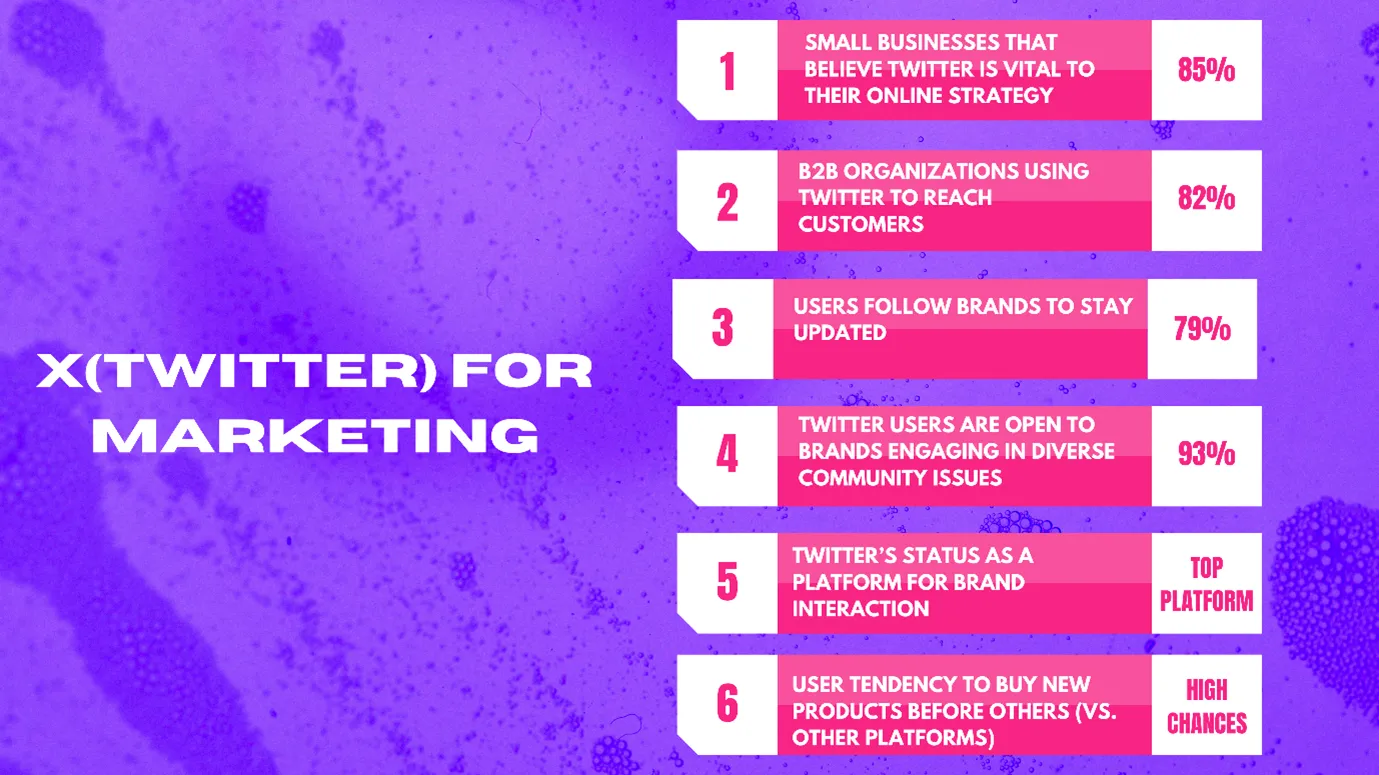
Twitter for Marketing & Brand Engagement
| Metric / Insight | Value / Detail |
|---|---|
| Small businesses that believe Twitter is vital to their online strategy | 85% |
| B2B organizations using Twitter to reach customers | 82% |
| Users follow brands to stay updated | 79% |
| Twitter users are open to brands engaging in diverse community issues | 93% |
| Twitter’s status as a platform for brand interaction | Considered the top platform |
| User tendency to buy new products before others (vs. other platforms) | More likely on Twitter |
Spending 6 hours writing posts that get zero traction?
Paste your URL. ZuAI turns it into 30 brand-on captions in 10 minutes — no blank-page panic, no generic AI filler.
X (Twitter) Statistics of Influencer Marketing.
- When we think of influencer marketing, we do not think of Twitter. TikTok or Instagram might be the first platforms that come to your mind.
But you will be surprised seeing the data.
10% (approx.) of influencer campaigns include Twitter as one of their approaches.
- The U.S.A. and the UK are the top markets for influencer marketing on Twitter.
Top Countries by X Influencer Engagement (2024)
| Country | Engagements (Billions) |
|---|---|
| United States | 37.00 |
| United Kingdom | 5.90 |
| Brazil | 4.86 |
| Canada | 2.90 |
| India | 2.45 |
- Elon Musk is the top influencer on Twitter.
This table shows the profiles that have the maximum followers on Twitter
(June 2025)
| Profile | Followers (Millions) |
|---|---|
| Elon Musk | 166.43 |
| Barack Obama | 131.96 |
| Justin Bieber | 111.50 |
| Cristiano Ronaldo | 110.43 |
| Rihanna | 108.48 |
| Katy Perry | 106.98 |
| Taylor Swift | 94.95 |
| Narendra Modi | 93.87 |
| Donald Trump | 87.44 |
| Ariana Grande | 85.27 |
| Lady Gaga | 83.79 |
Get 30 days of social content from your website — in 10 minutes.
Twitter usage statistics since Musk. Changes happening to Twitter after Elon Musk took over
In 2022, Elon Musk purchased Twitter and made it a private company.
- According to Musk, Twitter has made substantial improvements
X Platform Usage Growth Metrics
| Metric / Insight | Value / Detail |
|---|---|
| Increase in time spent on X in Japan | 26.6% |
| Overall increase in time spent on X (Jan 2024) | 9.5% |
| Increase in time spent on X (UK) | 9.0% |
| Increase in time spent on X (Canada) | 8.6% |
| Increase in time spent on X (US) | 7.4% |
| Unique X visitors (Feb 2025) | Over 900 million |
- Although Twitter’s name has changed to X, but the users have not moved on fully.
User Preference for Platform Name (Twitter vs. X)
| Country | Users Still Calling It “Twitter” (%) |
|---|---|
| United Kingdom | 70 |
| United States | 55 |
- Elon Musk has decided to expand Twitter and make it a “Super-App”
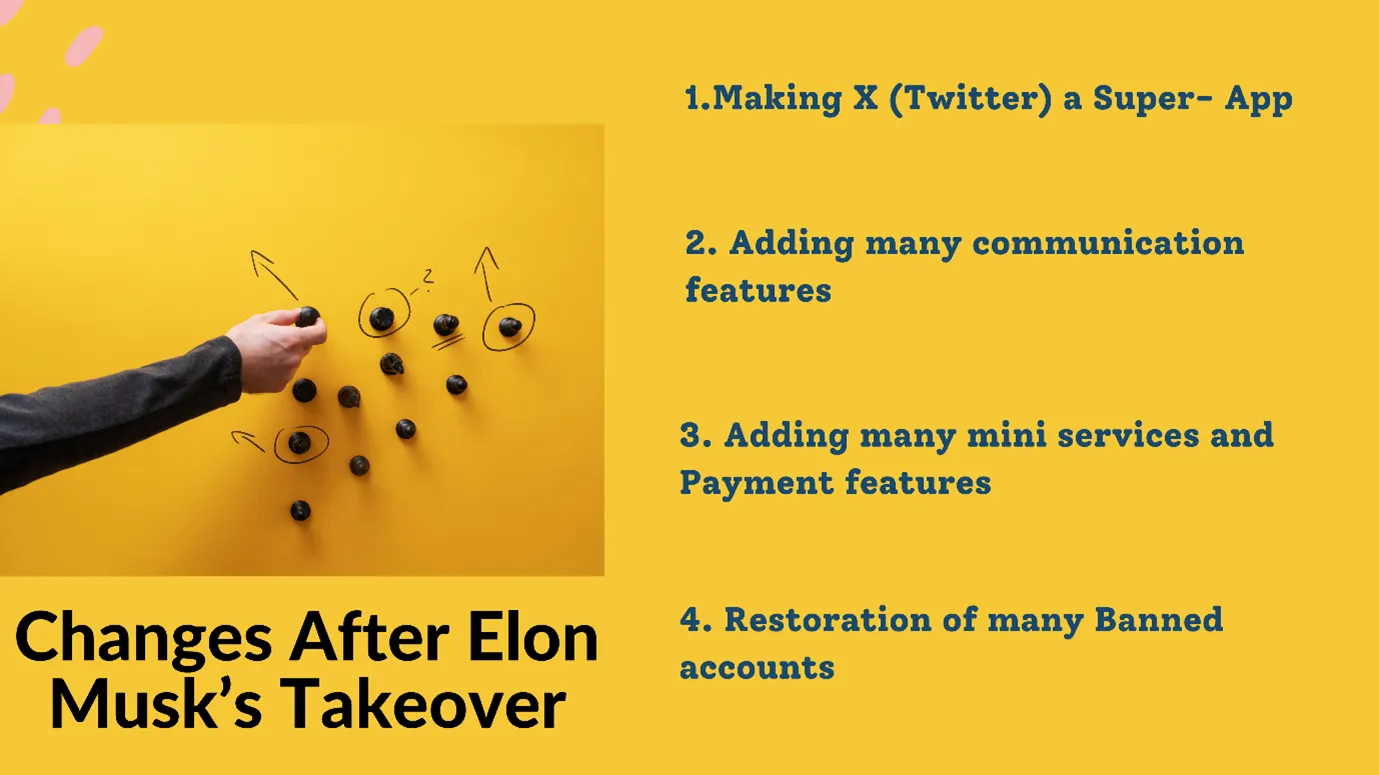
Key Features and Changes in the X
| Category | Details |
|---|---|
| Super-App Concept | Inspired by WeChat (China), an integrated ecosystem within a single app. |
| Communication Features | Video calls, voice calls, and messaging options. |
| Functional Additions | Mini-programs and payment services. |
| Account Reinstatements | Previously banned accounts restored (e.g., Kanye West, Donald Trump). |
- But the number of companies running ads on Twitter has reduced.
X Platform Audience Decline Metrics
| Metric / Insight | Value / Detail |
|---|---|
| Decline in ad reach (Jan 2024–Jan 2025) | −33.0 million users (−5.3%) |
| Projected decline in monthly active users (2022–2024) | 5% |
- Brands are posting less frequently on Twitter. The posting rates have decreased on Twitter.
Brand Tweet Frequency on X (decline trend)
| Metric / Insight | Value / Detail |
|---|---|
| Current median Tweet frequency (2025) | 2.16 Tweets per week |
| Previous median Tweet frequency (2024) | 3.31 Tweets per week |
- But as Elon Musk has lifted restrictions from many banned accounts, there is an increase in activity on those platforms.
10,000+ brands grew faster with one tool.
Five disadvantages of Twitter
Every social media platform has some pros and cons. So does Twitter. We have already seen in this blog that Twitter is huge and is used for a variety of reasons. Let us see all the cons of Twitter.
| Issue | Explanation |
|---|---|
| Declining user base | Twitter has seen a noticeable drop in active users and advertising reach. |
| Misinformation & polarization | Not everyone is genuine on Twitter; some fake accounts post misinformation and hate speech. |
| Short attention span | Tweets have a short lifespan, making it difficult to maintain visibility or momentum for announcements. |
| High volume of support requests | Once people learn that companies are on Twitter, they start posting issues publicly.
This can lead to public defamation or create a negative perception among the audience. |
| Confusion after Musk’s takeover | After Musk took over, many changes followed, including lifted restrictions, paid verification, and changes to content moderation policies. This has led to confusion and mistrust among users. |
See what ZuAI generates from your website — right now.
Paste your URL. Watch ZuAI write a month of brand-on captions in seconds. Preview before you create an account.
FAQ
PIs X (Twitter) growing or shrinking?
- There has been a decline in X (Twitter) revenue, but the decline may be temporary.
- Engagement has also reduced on X.
- But the number of sign-ups and video content is growing.
So, X might show decline for some time, but it has the potential to grow again.
How many Indians use Twitter?
This table shows the number of X (Twitter) users:
| Country | Users |
| United States | 103.96 million |
| Japan | 74.1 million |
| India | 30.3 million |
How many total Twitter users are there in the world?
This table shows the number of users:
| Monthly Active Users (MAUs) (as of Feb 2025) | 586 million+ |
| Daily Active Users (DAUs) (according to X) | 200–250 million |
One coffee from URL to a full month of scheduled posts.
Drop your URL, brew your coffee, come back to 30 brand-on captions ready to publish.
Key Takeaway
By seeing the number of users, engagements, and usage statistics on Twitter, you can understand that it is huge, and not being on Twitter can be a mistake for anyone.
Social media platforms give us a wonderful opportunity to connect with people all over the world and present ourselves. Do you want to know more about the other social media stats? Keep reading
Sources Referred
- statista
- https://penningtoncreative.com/the-origins-of-twitter/
- https://en.wikipedia.org/wiki/History_of_Twitter
- https://backlinko.com/twitter-users
- https://explodingtopics.com/blog/x-user-stats
- https://www.sixthcitymarketing.com/twitter-x-statistics/
- https://datareportal.com/essential-x-stats
- https://www.businessofapps.com/data/twitter-statistics
- https://www.socialpilot.co/blog/twitter-statistics
- https://sproutsocial.com/insights/twitter-statistics/
- https://blog.hootsuite.com/twitter-demographics/