Spending 6 hours writing posts that get zero traction?
Paste your URL. ZuAI turns it into 30 brand-on captions in 10 minutes — no blank-page panic, no generic AI filler.
Interesting LinkedIn stats:
Are you planning to use LinkedIn for your business? Do you wish to establish yourself as a brand on LinkedIn? Or are you thinking of growing and seeking new opportunities on this platform? Or maybe you are just wondering what LinkedIn can do for you.
In this blog, we will understand how and why LinkedIn is this huge (based on statistics). Here are 20 interesting stats about LinkedIn that will help you know more about LinkedIn and plan your next move on LinkedIn.
Get 30 days of social content from your website — in 10 minutes.
By History
In 2003, Reid Hoffman created a network to connect business professionals. He recruited his team, and LinkedIn was launched.
- Within one month of the launch, LinkedIn had 4500 followers. This was very surprising for the founders as they did not expect this much traffic, and soon investors seemed interested in investing in LinkedIn.
Here is a table that briefly explains LinkedIn’s journey. (source- historytools, history-computer)
| Year | Event |
|---|---|
| May 5, 2003 | Reid Hoffman launched LinkedIn. |
| 2004 | LinkedIn reached 1 million members within a year of its launch. |
| 2005 | Membership skyrocketed to over 6 million users by the end of the year. |
| 2005 | Introduced premium subscription services for enhanced search and additional features. |
| April 2006 | LinkedIn reached 10 million members. |
| October 2006 | LinkedIn reached 20 million members. |
| 2006 | Added new features to improve functionality: Recommendations, New search filters, LinkedIn Answers, LinkedIn Events, and LinkedIn Mobile. |
| May 2007 | LinkedIn reached 30 million members. |
| 2007 | Expanded the site’s search capabilities. |
| 2009 | Jeff Weiner became the CEO and President of LinkedIn. |
| 2011 | LinkedIn went public with a share price of $45, valued at $4.5 billion on the stock market. |
| October 2014 | Membership hit 300 million. |
| April 2017 | Membership reached 500 million. |
| 2016 | Microsoft acquired LinkedIn for $26 billion. |
| October 2020 | The user base reached 722 million. |
10,000+ brands grew faster with one tool.
By Region
LinkedIn is considered to be the most professional social media networking platform. There are 1.15 Billion users on LinkedIn worldwide.
This table shows the number of users based on region. (source-answeriq)
| Region | Population (in millions) |
|---|---|
| Northern America | 224.0 |
| Central America | 26.1 |
| Caribbean | 5.0 |
| Southern America | 112.1 |
| Western Europe | 64.3 |
| Northern Europe | 52.7 |
| Southern Europe | 45.9 |
| Eastern Europe | 20.8 |
| Europe (Total) | 242.0 |
| Northern Africa | 18.4 |
| Western Africa | 14.5 |
| Middle Africa | 2.8 |
| Eastern Africa | 10.8 |
| Southern Africa | 11.9 |
| Middle East & Africa | 54.0 |
| Western Asia | 41.8 |
| Central Asia | 2.1 |
| Southern Asia | 120.0 |
| Southeastern Asia | 59.9 |
| Eastern Asia | 73.5 |
| Asia-Pacific | 202.0 |
| Oceania | 17.5 |
| Latin America | 146.0 |
See what ZuAI generates from your website — right now.
Paste your URL. Watch ZuAI write a month of brand-on captions in seconds. Preview before you create an account.
By Country
LinkedIn is available across 200 countries. Here is a table showing the number of users according to country in 2024
- The United States has the highest number of LinkedIn users.
| Country | Number of LinkedIn Users in 2024 |
|---|---|
| 1. United States | 240 million |
| 2. India | 140 million |
| 3. Brazil | 78 million |
| 4. China | 58 million |
| 5. United Kingdom | 43 million |
| 6. France | 33 million |
| 7. Indonesia | 32 million |
| 8. Canada | 26 million |
| 9. Mexico | 25 million |
| 10. Italy | 22 million |
One coffee from URL to a full month of scheduled posts.
Drop your URL, brew your coffee, come back to 30 brand-on captions ready to publish.
4. By Number Of Active Users
- In 2024, LinkedIn had 1.15 billion active users, which is 15% more than the previous year
- 23.6 % of LinkedIn users log in daily
- 271 million daily active users constitute approximately 3.39% of the total world population.
The table shows the number of monthly active users year-wise.(source-demandsage)
| Year | Monthly Active Users |
|---|---|
| 2024 | 1.15 billion |
| 2023 | 1 billion |
| 2022 | 875 million |
| 2021 | 810 million |
| 2020 | 722 million |
| 2019 | 643 million |
| 2018 | 582 million |
| 2017 | 528 million |
Blank tab. Six open browsers. No clue what to post.


Paste one URL. Get 30 scheduled posts.
By Age Group Usage
The table below shows the number of users according to the age group. (source –demandsage)
| Age Group | Share of LinkedIn Users |
|---|---|
| 18–24 | 24.5% |
| 25–34 | 50.6% |
| 35–54 | 21.2% |
| 55+ | 3.8% |
- We can see that the maximum number of users are from the age group of 25-34.
- Millennials consist of 47% of total LinkedIn users. (source- socialpilot)
- 41% of millionaires are on LinkedIn
- 92 % of the Fortune-500 companies use LinkediIn.
- Users spend 7.27 minutes and 38 seconds per LinkedIn visit. (source- socialpilot)
Spending 6 hours writing posts that get zero traction?
Paste your URL. ZuAI turns it into 30 brand-on captions in 10 minutes — no blank-page panic, no generic AI filler.
By Gender And Time- Spent
- 15% of LinkedIn members used it several times a week, while 5% used it once a week.
- There are 48.5% of US LinkedIn app monthly users. (Source-jobera)
- 56.8% of LinkedIn users are Males, while 43.2% are females. (source-answeriq)
- The table below shows the number of users according to age group and gender.(source-answeriq)
| Age Group | Share of LinkedIn Female Users | Number of LinkedIn Female Users (millions) | Share of LinkedIn Male Users | Number of LinkedIn Male Users (millions) |
|---|---|---|---|---|
| 18–24 years | 9.4% | 87.42 | 11.7% | 108.81 |
| 25–34 years | 24.5% | 227.85 | 31.3% | 292.09 |
| 35–54 years | 8.4% | 78.12 | 11.7% | 108.81 |
| 55+ years | 1.0% | 9.3 | 1.9% | 17.67 |
Get 30 days of social content from your website — in 10 minutes.
By Reason Of Usage
The table shows the reason for LinkedIn usage in 2024. (source- obrelo)
| Purpose of LinkedIn | Percentage of users who list it as a reason they use LinkedIn |
| 1. Keep up to date with news and current events | 28.7% |
| 2. Follow or research brands and products | 25.1% |
| 3. Post or share photos or videos | 15.6% |
| 4. Message friends and family | 12.2% |
| 5. Look for funny or entertaining content | 10.6% |
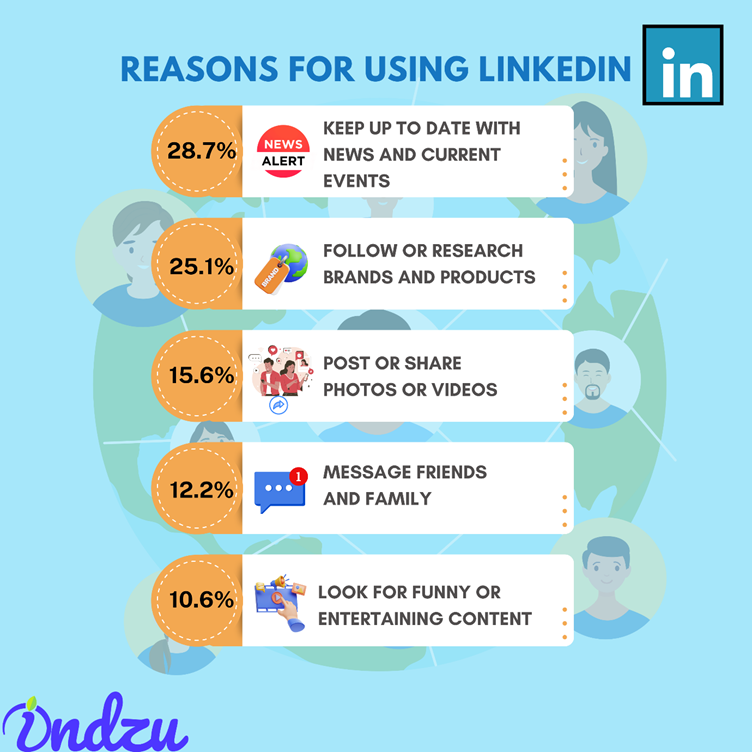
As we can see maximum number of people on LinkedIn keep up to date with news and current events.
10,000+ brands grew faster with one tool.
By Number Of Premium Users
- LinkedIn has 175 million premium users. (source- analyzify)
- 17.5 % of LinkedIn users are Premium members.
- The table below shows the number of premium users till the year 2023.((source- socialpilot))
| Year | Basic Subscription (in millions) | Premium Subscription (in millions) |
|---|---|---|
| 2019 | 549.96 | 94.12 |
| 2020 | 586.49 | 114.22 |
| 2021 | 602.55 | 134.32 |
| 2022 | 561.41 | 154.42 |
| 2023 | 571.27 | 174.51 |
- Premium sign-ups have increased by 51% in fiscal year 2024, with new AI tools adding more value. ( source-analzify)
See what ZuAI generates from your website — right now.
Paste your URL. Watch ZuAI write a month of brand-on captions in seconds. Preview before you create an account.
By Business Presence
For getting leads and expanding the Business, LinkedIn has sales navigator mode
A Total of 413 industries have subscribed to LinkedIn sales navigator mode. (source- skylead)
- This table shows the industries that are present on LinkedIn sales navigator mode. (source- skylead)
| Rank | Number of Companies | Industry |
|---|---|---|
| 1 | 3,010,000 | Real Estate |
| 2 | 2,550,000 | Medical Practice |
| 3 | 2,450,000 | Construction |
| 4 | 2,290,000 | Retail |
| 5 | 1,640,000 | Management Consulting |
| 6 | 1,620,000 | Individual & Family Services |
| 7 | 1,450,000 | Restaurants |
| 8 | 1,420,000 | Computer Software |
| 9 | 1,410,000 | Information Technology & Services |
| 10 | 1,010,000 | Wholesale |
The table below shows the number of companies listed on Linkedin per year. (source-omnicoreagency)
| Year | Number of Companies (in Millions) |
|---|---|
| 2017 | 18 |
| 2018 | 26 |
| 2019 | 30 |
| 2020 | 50 |
| 2021 | 57 |
| 2022 | 58 |
| 2023 | 67 |
One coffee from URL to a full month of scheduled posts.
Drop your URL, brew your coffee, come back to 30 brand-on captions ready to publish.
By Number Of Growing Users
People have loved LinkedIn, this is indicated by the growing number of users as of each year.
It is wisely said that “Your Network is Your Net Worth”
The table shows the number of LinkedIn users each year..(source- skrapp, answeriq)
| Year | Number of LinkedIn Users (in millions) |
|---|---|
| 2009 | 42 |
| 2010 | 78 |
| 2011 | 116 |
| 2012 | 174 |
| 2013 | 238 |
| 2014 | 313 |
| 2015 | 380 |
| 2016 | 450 |
| 2017 | 491 |
| 2018 | 556 |
| 2019 | 604 |
| 2020 | 690 |
| 2021 | 756 |
| 2022 | 830 |
| 2023 | 930 (as of Q1 2023) |
| 2024 | 1,150 |
Blank tab. Six open browsers. No clue what to post.
Paste one URL. Get 30 scheduled posts.
By Engagement
- LinkedIn is the best platform for getting organic reach
- 99.63% of LinkedIn search traffic comes from organic search
- 77% of the creators say that – LinkedIn delivers the highest organic results
- Long form of content performs best on LinkedIn, A written content of around 1800-2000 words performs best on LinkedIn
- Also posts with 50-60 words perform better on LinkedIn.
- Turning on creator mode has been very beneficial for creators, it has brought 50 % more followers and 30% more engagement
Here are some interesting facts about LinkedIn engagement
| Metric | Value |
|---|---|
| Percentage of LinkedIn users actively seeking industry insights | 60% |
| Total feed updates viewed on LinkedIn | 280 billion |
| Impressions on content compared to job postings | 15× more impressions on content |
| Number of users subscribed to LinkedIn Newsletters | 450 million |
| Number of LinkedIn members publishing weekly content | 3 million |
| Active LinkedIn Pages engagement (compared to inactive pages) | 5× more views, 7× more impressions, 11× more clicks |
| Businesses posting weekly see follower growth | 5.6× growth |
| Including links in LinkedIn updates increases engagement | 45% higher engagement |
| Images in LinkedIn posts increase the comment rate | 98% higher comment rate |
| Accounts with completed and updated information gain more opportunities | 40× more opportunities |
| Increase in messages sent year-over-year | 35% |
| The average number of messages sent daily on LinkedIn | 100 million |
| Weekly LinkedIn members engaging heavily with content return daily | 5× more likely |
| Members with 5+ skills on their profiles are connected more by recruiters | 33× more |
| Members with 5+ skills on their profiles receive more views | Up to 17× more views |
Here’s the data structured in a table format:
| Metric | Value |
|---|---|
| Median engagement rate per follower | 0.41% |
| Median posts per week per brand | 3.3 posts |
| Percentage of brands publishing more than 10 posts per week | Nearly 10% |
| Average engagement rate by impression | 4.73% |
| Average video views per 100 impressions (accounts < 5,000 followers) | 49 views |
| Average video views per 100 impressions (accounts > 100,000 followers) | 35 views |
Here is the table showing the data of impressions on accounts per their followers (as of Jan 2023- Sep 2023) (source-RivalIq)
| Follower Count | Impressions per Follower |
|---|---|
| 2k–5k | 15.7% |
| 5k–10k | 10.0% |
| 10k–25k | 11.4% |
| 25k–100k | 7.2% |
| >100k | 3.2% |
Here the table shows engagement according to the post format.(as of Jan 2023- Sep 2023) (source-RivalIq)
| Post Type | Engagement Rate by Impression (%) |
|---|---|
| Document | 18.2% |
| Collage | 14.0% |
| Photo | 5.1% |
| Article | 4.4% |
| Video | 4.1% |
| Status | 3.2% |
Here the table shows the post volume of each kind of post .(as of Jan 2023- Sep 2023) (source-RivalIq)
| Post Type | Posting Volume (%) |
|---|---|
| Photo | 42% |
| Article | 23% |
| Video | 17% |
| Status | 8% |
| Collage | 6% |
| Document | 4% |
Spending 6 hours writing posts that get zero traction?
Paste your URL. ZuAI turns it into 30 brand-on captions in 10 minutes — no blank-page panic, no generic AI filler.
By Revenue
LinkedIn generates its revenue primarily from Ads and Subscriptions.
Here is the table showing the revenue of LinkedIn from 2019 to 2023.(source- statista)
| Year | Revenues from Advertising (in billion USD) | Other Revenues (in billion USD) | Revenue from Premium Accounts (in billion USD) | Total Revenue (in billion USD) |
|---|---|---|---|---|
| 2019 | 2.17 | 1.49 | 3.47 | 7.13 |
| 2020 | 2.28 | 1.57 | 4.21 | 8.06 |
| 2021 | 3.16 | 2.17 | 4.95 | 10.28 |
| 2022 | 4.83 | 3.29 | 5.70 | 13.82 |
| 2023 | 5.93 | 3.95 | 6.44 | 16.32 |
- By 2026, The Ad revenue would reach to $8 USD. (source- usesignhouse.com)
Get 30 days of social content from your website — in 10 minutes.
By Business Usage
- 44% of marketers say that LinkedIn is the optimum platform for B2B marketing
- 54 % of B2C marketers use LinkedIn for marketing(source-analyzify)
- 65 % of the global marketers use LinkedIn for marketing. (source-statista)
- 40% of B2B marketers said that LinkedIn can most effectively generate high-quality leads
- Here the table shows how Businesses have leveraged LinkedIn( source- Demandsage, Socialpilot)
| Metric | Value |
|---|---|
| Brands perceived as higher quality after advertising on LinkedIn | 50% |
| Brands perceived as “more professional” | 92% |
| Brands perceived as “more intelligent” | 74% |
| Brands perceived as “more respectable” | 59% |
| Short-term sales uplift due to LinkedIn advertising | 10–15% |
| Social media traffic to company websites coming from LinkedIn | 46% |
| Lead Gen Forms conversion improvement | 3× more |
| LinkedIn Live stream engagement | 7× more reactions, 24× more comments than regular videos |
| Business-to-business software product pages on LinkedIn | Over 10,000 |
10,000+ brands grew faster with one tool.
By Audience Reach
Audiences of different countries respond to LinkedIn, the table below shows the audience reach of LinkedIn in various countries/regions as of April 2024. (sources- statista)
| Country/Region | Reach (%) |
|---|---|
| Cayman Islands | 115.6 |
| Bermuda | 111.6 |
| U.A.E. | 104.0 |
| U.S. Virgin Islands | 101.4 |
| Iceland | 95.1 |
| Andorra | 94.1 |
| United States | 85.8 |
| Netherlands | 83.4 |
| Singapore | 82.8 |
| Ireland | 79.3 |
| United Kingdom | 76.1 |
| Canada | 75.5 |
| Luxembourg | 74.6 |
| Malta | 73.0 |
| Aruba | 72.2 |
| Australia | 71.7 |
| Denmark | 71.1 |
| New Zealand | 70.9 |
| Guam | 67.9 |
| Guernsey | 67.0 |
See what ZuAI generates from your website — right now.
Paste your URL. Watch ZuAI write a month of brand-on captions in seconds. Preview before you create an account.
By Marketing & Advertising Numbers
- LinkedIn Ad revenue is supposed to generate 10.35 USD by 2027 (source-hootsuite)
- Vertical format ads are more effective than horizontal format Ads.(source-hootsuite)
- Display ads and video ads are more popular on LinkedIn
But out of these two formats display ads are more popular.
(source-hootsuite)
| Impact Area | Display Ads Impact (%) | Video Ads Impact (%) |
|---|---|---|
| Brand Favorability | +9% | +12% |
| Research Intent | +5% | +8% |
| Purchase Consideration (Product) | +8% | +9% |
- LinkedIn ads have helped brands to get 33% more purchase intent from customers. (source-hootsuite)
- 59 million companies(approx.) have a LinkedIn Page. (source-business2community)
- Marketers can access up to nine times more monthly touchpoints through LinkedIn ads.
- LinkedIn Conversation Ads drive four times higher open rates and engagement rates than traditional email and twice the engagement as Message Ads.
- LinkedIn Sponsored Messaging drives twice as high open and engagement rates as traditional email.
- Brands that advertise on LinkedIn experience an average of 10 to 15% lift in short-term ad performance. . (source-business2community)
- 666.3 million users who use LinkedIn as an advertising medium (source- jobera)
- 12% of the adults available to marketers can be reached through the platform (source- jobera)
- LinkedIn’s advertisement audience is increasing by 1.6%.
- 43% of the LinkedIn advertisement audience is women, while 57% are male. (source- jobera)
- The US has reached LinkedIn advertising 160,000,000 which puts it on top of all countries. (source- jobera)
This table shows how LinkedIn ads are more effective for marketers and businesses
(source- Socialpilot)
| Metric | Value |
|---|---|
| Percentage of the world’s population reachable by LinkedIn ads | 14.6% |
| Cost per lead comparison: LinkedIn vs. Google Ads | 28% less than Google Ads |
| Percentage of LinkedIn marketers wanting to run product and demand generation campaigns simultaneously | Over 50% |
| Global average CTR (Click-Through Rate) for sponsored content | 0.44%–0.65% |
| ROAS (Return on Ad Spend) on LinkedIn | 2–5× higher than other social media platforms |
| LinkedIn Live stream engagement | 7× more reactions and 24× more comments compared to regular videos |
One coffee from URL to a full month of scheduled posts.
Drop your URL, brew your coffee, come back to 30 brand-on captions ready to publish.
By Number Of Employees on LinkedIn
The number of employees on LinkedIn has always increased consistently.
| Year | Number of Employees |
|---|---|
| 2019 | 9,772 |
| 2020 | 12,682 |
| 2021 | 16,000 |
| 2022 | 19,000 |
| 2023 | 20,000 |
- 54.3% of employees are male, while 45% are female and 0.6 have not disclosed their gender.
- 57.9% of the leadership roles are taken by male and females consists of 41.8% of leadership roles. 0.4% of leadership roles are taken by undisclosed gender.
Blank tab. Six open browsers. No clue what to post.
Paste one URL. Get 30 scheduled posts.
By Traffic
- LinkedIn’s mobile app accounts for 60% of its total traffic.(source-linkedIn)
- click.appcast.io gives the highest traffic referrers to LinkedIn
This table shows the traffic referrers to LinkedIn as of March 2024.
(source-statista)
| Website | Share of Traffic (%) |
|---|---|
| click.appcast.io | 8.54% |
| statics.teams.cdn.office.net | 7.89% |
| github.com | 7.32% |
| linktr.ee | 4.26% |
| linkedin.okta.com | 1.93% |
- USA is the highest contributor to LinkedIn traffic and hence the largest market for LinkedIn
This table shows the traffic LinkedIn gets from different countries as of March 2024. (source-statista)
| Country | Share of Traffic (%) |
|---|---|
| United States | 31.25% |
| India | 6.98% |
| United Kingdom | 6.01% |
| Brazil | 4.17% |
| Canada | 4.04% |
- In social media platforms, YouTube gives the highest amount of traffic to LinkedIn
This table shows the traffic LinkedIn gets from different social media platforms as of March 2024:(source-statista)
| Website | Share of Traffic (%) |
|---|---|
| youtube.com | 37.52% |
| twitter.com | 16.49% |
| web.whatsapp.com | 16.16% |
| facebook.com | 14.79% |
| instagram.com | 4.49% |
Spending 6 hours writing posts that get zero traction?
Paste your URL. ZuAI turns it into 30 brand-on captions in 10 minutes — no blank-page panic, no generic AI filler.
By Recruitment Trends
LinkedIn is the largest networking platform in the world. It is extensively used for hiring or job search purposes.
-
For Hiring
-
LinkedIn is being used by 97% of HR and staffing professionals
- 67% of professionals believe that candidates hired through LinkedIn are of higher quality.
The table shows how LinkedIn has helped in the hiring processes
Here’s your data formatted into a table:
| Metric / Information | Value / Details |
|---|---|
| Open jobs on LinkedIn | Over 14 million |
| Job applications submitted every second on LinkedIn | 81 |
| Total job applications submitted every month on LinkedIn | 210M+ |
| People hired every minute on LinkedIn | 4 |
| Top 5 trending jobs in Q4 2020 based on hired LinkedIn members (LinkedIn 2021) | 1. Software Engineer, 2. Real Estate Agent, 3. Project Manager, 4. Account Executive, 5. Salesperson |
| Percentage of larger companies (500+ employees) likely to increase recruitment investment on LinkedIn (Jobvite, 2020) | 48% |
| Improvement in the quality of new hires for organizations investing in a strong candidate experience | 70% |
| People helped by LinkedIn’s “Jobs for You” feature | 4 million |
Get 30 days of social content from your website — in 10 minutes.
For Getting Job
LinkedIn has helped many candidates secure jobs or make a career progress
- Student sign-ups have increased by 73% year-over-year
- LinkedIn has also been popular among GEN-Z
This table shows how LinkedIn has helped in Job search process
| Metric / Information | Value / Details |
|---|---|
| Candidates with a comprehensive LinkedIn profile having a higher chance of getting a job interview | 71% |
| LinkedIn users who have added #OpenToWork frames to their profiles | 20 million |
| People helped by LinkedIn’s “Jobs for You” feature | 4 million |
| Percentage of people who recently changed jobs and used LinkedIn to find new opportunities | 75% |
| People hired every minute on LinkedIn (The Social Shepherd) | 6 |
| Total hires annually through LinkedIn (The Social Shepherd) | Over 3 million |
| People using LinkedIn to search for jobs every week | 40 million |
| Total job applications submitted every month on LinkedIn | 210M+ |
| People using LinkedIn’s #OpenToWork feature | 8M+ |
| Job applications submitted every second on LinkedIn | 77 |
| Total job applications submitted every day on LinkedIn | Over 6.6 million |
| Percentage of people who recently changed jobs and used LinkedIn to find new job opportunities | 75% |
- When recruiters browse both male and female profiles on LinkedIn, 13% of them are more likely to click on a male candidate’s profile in a search result. (Source-LinkedIn, 2019)
- 41% of companies have seen an increase in the percentage of new hires that are minorities and women(source-Gohire).
(source- skrapp.io, LinkedIn,business2community, financeonline)
10,000+ brands grew faster with one tool.
By Skill Development And Learning
- 13000 organizations in the world use LinkedIn Learning
- In 2023, LinkedIn integrated with VIVA to provide better learning opportunities
- 40,000 skills are listed on LinkedIn
Here’s the table showing how LinkedIn learning has been popular among recruiters and learners. (source LinkedIn 2021, LinkedIn 2019)
| Metric / Information | Value / Details |
|---|---|
| LinkedIn Learning courses available | Over 20,000 courses in seven languages |
| LinkedIn Learning offers | Over 16,000 courses |
| Top 3 priority programs of L&D professionals (LinkedIn Workplace Learning Report) | 1. Upskilling and reskilling (59%), 2. Leadership and management (53%), 3. Virtual onboarding (33%) |
| Top skill to be developed (US, New Zealand, France, Australia, UK) | Resilience |
| Top skill to be developed (India, Germany, Southeast Asia) | Digital fluency |
| Top 5 trending skills worldwide in Q4 2020 | 1. Teaching, 2. JavaScript, 3. Curriculum Development, 4. Account Management, 5. Sales Management |
| Most engaging topic among LinkedIn members | Technology |
| L&D investment trends | Shift from instructor-led training (ILT) to online learning solutions like LinkedIn Learning |
| Percentage of recruiters using skills data to fill roles | Over 45% |
| Users who engage in regular learning activities on LinkedIn | 25% more likely to report a positive career impact |
| Top job functions on LinkedIn | Sales, operations, and engineering |
| Increase in content creation jobs on LinkedIn | 49% |
| Increase in remote job postings since the pandemic | 2.5× |
| Most popular course in 2023 | “Excel Essential Training” |
| Total hours of LinkedIn Learning content watched | Over 1 million |
| Percentage of LinkedIn Learning users motivated by skill-building for their current job | 57% |
| Top 5 most popular LinkedIn Learning courses | Includes courses on “Leadership” and “Communication” |
| Most listed job titles on LinkedIn | “Founder” |
| LinkedIn’s “Who’s Viewed Your Profile” feature | One of its most popular |
| Articles published by members on LinkedIn | Over 1 million |
| LinkedIn’s “Skills Endorsements” feature | Over 10 billion endorsements were generated |
Current Trends In LinkedIn Job Postings
| Metric / Information | Value / Details |
|---|---|
| Annual increase in AI and machine learning jobs on LinkedIn | 74% |
| Predicted increase in remote job postings on LinkedIn by 2025 | 150% |
| Growth in sustainability and renewable energy jobs on LinkedIn | 49% |
| Increase in job postings requiring digital marketing skills | 60% |
(source- skrapp.io, LinkedIn,business2community, financeonline)
See what ZuAI generates from your website — right now.
Paste your URL. Watch ZuAI write a month of brand-on captions in seconds. Preview before you create an account.
By Sales Navigator Usage
- Sales navigator has various filters, like 30 advanced filters, including company size, industry, job title, and geography. This helps in creating detailed and specific lead lists.
Here is a table showing how companies are leveraging Sales Navigator
| Metric / Information | Value / Details |
|---|---|
| ROI of companies using Sales Navigator | 17% higher win rate on average |
| InMail message response rate for Sales Navigator users | 30% higher compared to standard LinkedIn messages |
| Total professionals using Sales Navigator | Over 700,000 |
| Common users of Sales Navigator | Widely used by sales teams across industries, especially mid-sized companies (51–1,000 employees) |
(source-skrapp.io, LinkedIn,business2community, financeonline )
One coffee from URL to a full month of scheduled posts.
Drop your URL, brew your coffee, come back to 30 brand-on captions ready to publish.
By LinkedIn’s Unique Demography
- Since LinkedIn is the largest professional network in the world, it is used mostly for growing networks, career-building, business growth, and brand-building
Hence LinkedIn demography is very different and interesting than other social media platforms.
This table shows the unique demography of LinkedIn (source- LinkedIn 2021, LinkedIn 2019, LinkedIn 2022, Post 2020)
| Metric / Information | Value / Details |
|---|---|
| Total professionals using LinkedIn | More than 690 million |
| Educational background of LinkedIn members (December 2022) | ⅓ have a bachelor’s degree, 23% have a master’s degree or equivalent, and 2% have a secondary-level education |
| MBA degree holders active on LinkedIn | 3 million |
| Contractors, students, fresh graduates, and skilled workers on LinkedIn | 12M contractors, 46M students and fresh graduates, 80M hourly and skilled workers |
| Percentage of LinkedIn users who influence business decisions | 90% |
| Senior-level managers on LinkedIn | 90 million, of which 63 million are decision-makers |
| IT decision-makers on LinkedIn | 6 million |
(source-skrapp.io, LinkedIn,business2community, financeonline)
Blank tab. Six open browsers. No clue what to post.
Paste one URL. Get 30 scheduled posts.
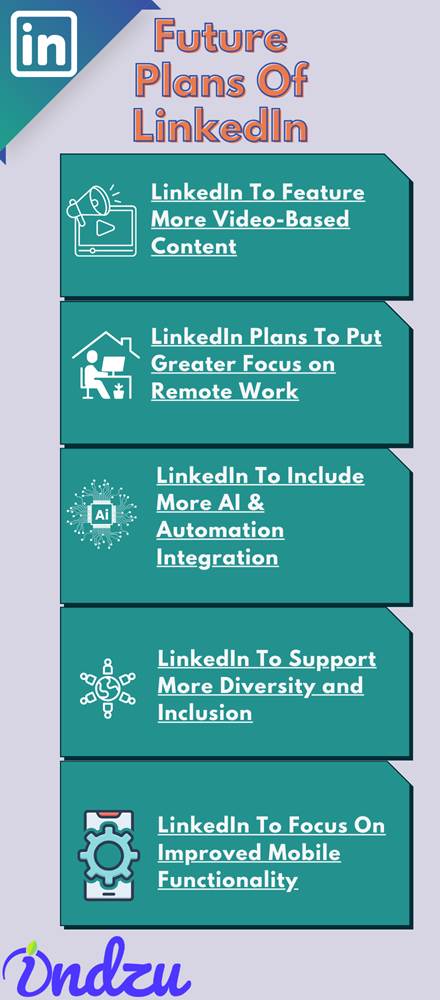
By Future Growth
- LinkedIn is very soon going to emphasize video based content, as video content is liked more by the audience
- As more and more people prefer hybrid or remote work settings, LinkedIn is planning to put greater focus on remote work.
- LinkedIn is going to include more AI and automation integration in its settings so that it can smoothen the hiring and recruitment process.
- LinkedIn is going to focus more on diversity and inclusion as it plans to expand its user base
- As more people focus on using LinkedIn on mobile devices, LinkedIn is planning to improve the mobile functionality.
Spending 6 hours writing posts that get zero traction?
Paste your URL. ZuAI turns it into 30 brand-on captions in 10 minutes — no blank-page panic, no generic AI filler.
The Ifs, Buts & Pitfalls Of LinkedIn
-
Privacy concerns
LinkedIn allows advertisers to target people on LinkedIn by sharing the data it collects through users’ profiles.
-
A Constant Pressure To Build & Maintain Professional Image
As there are so many professionals present on LinkedIn, there is always a need felt on LinkedIn to be polished. This causes people to constantly post articles or updates on the platform and hence authenticity gap is created
-
Misleading Information
Even LinkedIn has many fake accounts and people get cheated via these fake accounts.
Users encounter misleading career advice or business strategies.
-
Algorithm Limitations & Opportunity Misses
The algorithm made to connect job seekers and recruiters is sometimes ineffective and results in missed opportunities.
59% of candidates have abandoned an online application due to issues or bugs on the website, and 60% have quit filling out an application because of its length or complexity (source-Gohire)
-
Emphasis On Achievements & Comparisons
LinkedIn encourages showcasing awards, endorsements, and a linear career trajectory. It also focuses more on titles and awards, which can detract from the importance of soft skills and experience. This gives rise to a competitive environment which is unhealthy in the long run.(source-projectmanagers.net, advergize.com)
Conclusion
LinkedIn has a huge user base and it the most professional social media platform present today. No business should ignore this opportunity.
If you want to know about other social media platform stats. Then check our other blogs.