Do you think of purchasing something and search for it on Instagram before purchasing? Instagram’s founder did exactly this before creating Instagram.
Kevin, a Stanford University graduate, wanted some Whiskey and was curious about all those places that sold Whiskey. So he created an app called ‘Burbn’ where people could share their photos and check-ins.
Gradually, he realized that people were more interested in photo-sharing and specifically focused on a photo-sharing app.
Instagram History
- Launched on October 6, 2010 (only for iOS) and reached 25000 users within one day.
- By the end of the first week, it was downloaded by 1 lakh users
- It was already making a buzz by mid-December, as 1 million people had downloaded it. (source– historytools)
| Date | Event |
|---|---|
| October 2010 | Instagram reached 100,000 users |
| December 2010 | Instagram reached 1 million users |
| January 2011 | Instagram reached 2 million users |
| September 2011 | Instagram reached 10 million users |
| April 3, 2012 | Instagram released its Android app |
| April 9, 2012 | Facebook acquired Instagram for $1 billion in cash and stock |
| April 12, 2012 | Instagram ranked #4 on the Android charts |
| February 2013 | Instagram hit 100 million monthly active users (MAU) |
| June 2016 | Instagram hit 500 million monthly active users (MAU) |
| June 2018 | Instagram hit 1 billion monthly active users (MAU) |
- The launch of Instagram on Android opened the floodgates, and users came rushing in, and ever since, it has been our favorite.
- If we fast forward today, Instagram has 2 Billion active monthly users. ( Source-demandsage, backlinko)
Reasons Of Instagram’s Popularity
- People love that Instagram runs smoothly on their Phones
- People have responded well to images from the beginning, and Instagram was primarily built to share pictures.
- It is extremely easy to use. Its simple interface gives users a platform to express themselves in front of others.
- Instagram has evolved continuously. It added “stories,” “Reels,” “shopping facilities,” “stickers,” “filters,” etc. which helped engage the audience more.
- The platform supports personal branding; many people could become influencers, and businesses could market themselves well.
Let us understand Instagram’s Popularity by 20 Interesting statistics ( data-backed)
 Time killer · Pain
Spending 6 hours writing posts that get zero traction?
Paste your URL. ZuAI turns it into 30 brand-on captions in 10 minutes — no blank-page panic, no generic AI filler.
By Region
Instagram Users by Region (millions)(source- Prioridata)
| Region | Users (in millions) |
|---|---|
| Asia-Pacific | 893 |
| Europe | 338 |
| South America | 289 |
| North America | 222 |
| Middle East | 112 |
| Africa | 96 |
| Australia | 22 |
Outcome · RecommendedGet 30 days of social content from your website — in 10 minutes.
By Number Of Users
Instagram has 2 billion monthly active users, the third highest among all social media platforms.
Out of 8.2 billion people worldwide, 2 billion people use Instagram, and 24.39% of the total population uses Instagram. (monthly)
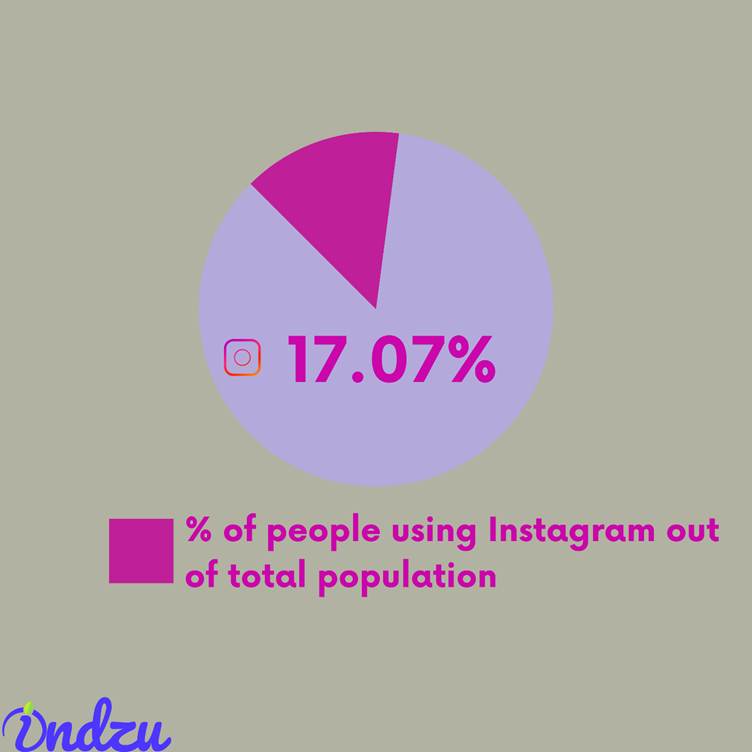
However, daily Instagram users are 1.40 billion, or 17.07 % of the world’s population.
It is forecasted that by 2025 it will increase to 1.44 billion. (Source- Statista)
| Year | Number of Instagram Users Worldwide (in Billions) |
|---|---|
| 2020 | 1.04 |
| 2021 | 1.21 |
| 2022 | 1.28 |
| 2023 | 1.35 |
| 2024 | 1.40 |
| 2025* | 1.44 |
Proof · Verified
2k+ grew faster with one tool.
By Country
India has the highest number of Instagram users (as of 2024). The number of Indian users is expected to grow more.
| Country | Instagram Audience Size (in Millions) |
|---|---|
| India | 362.9 |
| United States | 169.65 |
| Brazil | 134.6 |
| Indonesia | 100.9 |
| Turkey | 57.1 |
| Japan | 55.45 |
| Mexico | 44.85 |
| United Kingdom | 33.1 |
| Germany | 30.35 |
| Argentina | 27.85 |
| Italy | 27.0 |
| France | 25.9 |
Free · Instant · No signupSee what ZuAI generates from your website — right now.
Paste your URL. Watch ZuAI write a month of brand-on captions in seconds. Preview before you create an account.
By Time Spent
An average Android user spends 33.9 minutes daily (16 hours 56 minutes per month) on the app. (Source- backlinko).
This is the 4th highest amount of time spent on any social media platform
This table shows the average time a US adult spends on Instagram (age-wise).
| Age | Average Time Spent per Day |
|---|---|
| 18–24 | 53 minutes |
| 25–34 | 37 minutes |
| 35–44 | 28 minutes |
| 45–54 | 27 minutes |
| 55–64 | 26 minutes |
| 65+ | 20 minutes |
- Maximum time spent is by the age bracket of 25-34 years.
Speed · 10-minute setupOne coffee from URL to a full month of scheduled posts.
Drop your URL, brew your coffee, come back to 30 brand-on captions ready to publish.
By Gender
- 50% + of the global Instagram population was 34 years or younger.
- Instagram had more male users
- More millennials use Instagram.
This table shows the data of global active Instagram users as of April 2024. (source-statista)
| Age Group | Female Users (%) | Male Users (%) |
|---|---|---|
| 18–24 | 15.2% | 16.5% |
| 25–34 | 14.2% | 16.4% |
| 35–44 | 8.1% | 7.9% |
| 45–54 | 4.8% | 3.9% |
| 55–64 | 2.7% | 1.9% |
| 65+ | 1.7% | 1.2% |
Instagram gender demographics 2023 (%) (Source-businessofapps)
| Gender | Percentage of Users (%) |
|---|---|
| Male | 50.7% |
| Female | 49.3% |
Blank tab. Six open browsers. No clue what to post.

 After · With Indzu
Paste one URL. Get 30 scheduled posts.
By Age
- Approximately 62 % of Instagram users are below 35 years of age
- This shows that more number of youngsters are active on Instagram.
This table shows the data of Instagram users worldwide of April 2024
| Age Group | Percentage of Users (%) |
|---|---|
| 18–24 | 31.7% |
| 25–34 | 30.6% |
| 35–44 | 16.0% |
| 45–54 | 8.7% |
| 55–64 | 4.6% |
| 65+ | 2.9% |
Time killer · Pain
Spending 6 hours writing posts that get zero traction?
Paste your URL. ZuAI turns it into 30 brand-on captions in 10 minutes — no blank-page panic, no generic AI filler.
By Usage
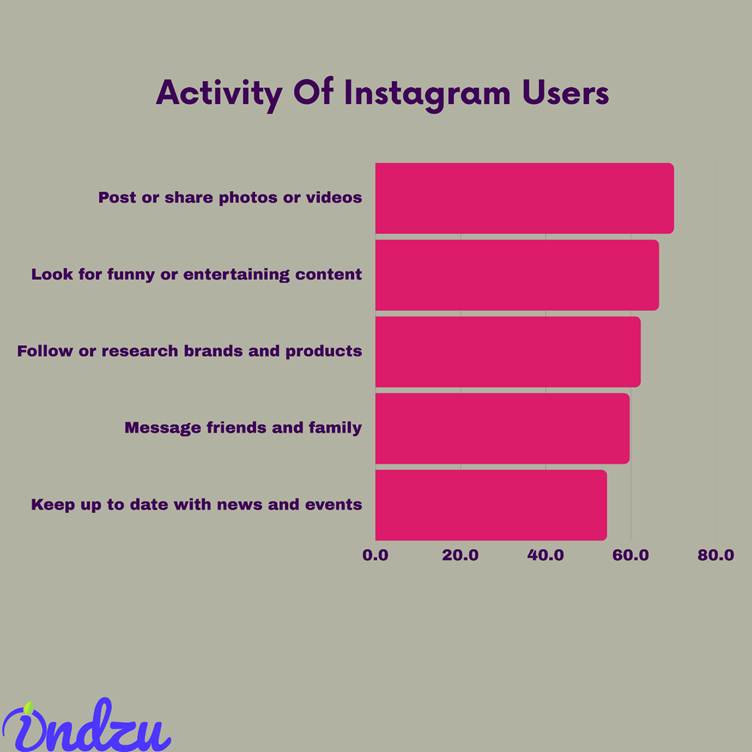
Most people love to use Instagram to post or share videos. (Source-Obrelo)
This is the data of Instagram Users in 2024.
| Activity of Instagram Users | Percentage (%) |
|---|---|
| Post or share photos or videos | 70.1% |
| Look for funny or entertaining content | 66.6% |
| Follow or research brands and products | 62.3% |
| Message friends and family | 59.7% |
| Keep up to date with news and events | 54.4% |
 Outcome · Recommended
Get 30 days of social content from your website — in 10 minutes.
By Business Activity
Since Instagram is the third most popular social media platform, businesses never miss a chance to show their presence on Instagram.
- On average, brands posted 4.6 posts /per week. (source-whop)
According to RivalIQ, the top industry present on Instagram (as of 2023)
| Industry | Posting Frequency |
|---|---|
| Higher Education | 3.9 posts per week |
| Sports Teams | 15.6 posts per week |
| Influencers | 4.1 posts per week |
| Nonprofits | 5 posts per week |
| Media | 10 posts per week |
Proof · Verified
2k+ grew faster with one tool.
By Growing Number Of Users
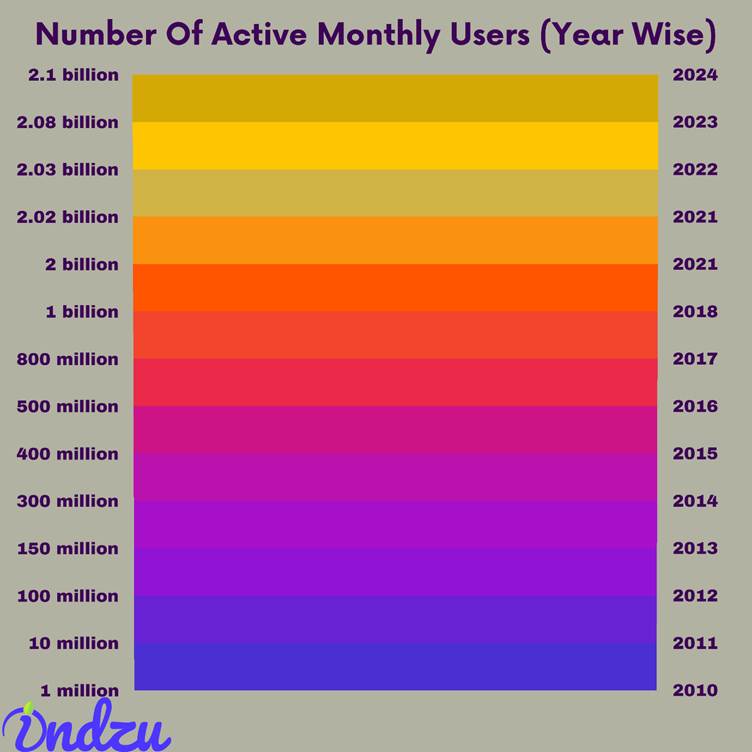
The average growth rate of Instagram monthly active users is approximately 26%
This table shows the number of Monthly active users each year( (source- sendshort.ai)
| Year | MAU (Monthly Active Users) |
|---|---|
| 2024 | 2.1 billion |
| 2023 | 2.08 billion |
| 2022 | 2.03 billion |
| 2021 | 2.0 billion |
| 2018 | 1 billion |
| 2017 | 800 million |
| 2016 | 500 million |
| 2015 | 400 million |
| 2014 | 300 million |
| 2013 | 150 million |
| 2012 | 100 million |
| 2011 | 10 million |
| 2010 | 1 million |
 Free · Instant · No signup
See what ZuAI generates from your website — right now.
Paste your URL. Watch ZuAI write a month of brand-on captions in seconds. Preview before you create an account.
10. By Engagement
People share various content on Instagram, such as photos, videos, reels, and carousels.
- Instagram has the highest engagement rate (higher than any other social media platform) for any kind of post (source- zippia)
This table shows the average engagement rate for each type of post. (by business account) (source- oberlo)
| Instagram Post Type | Average Engagement Rate (%) |
|---|---|
| All Post Types | 0.56% |
| Photo Posts | 0.50% |
| Video Posts | 0.55% |
| Carousel Posts | 0.69% |
- A study also states that carousels having 10 slides maximum get more engagement. A carousel with four slides gets minimum engagement.
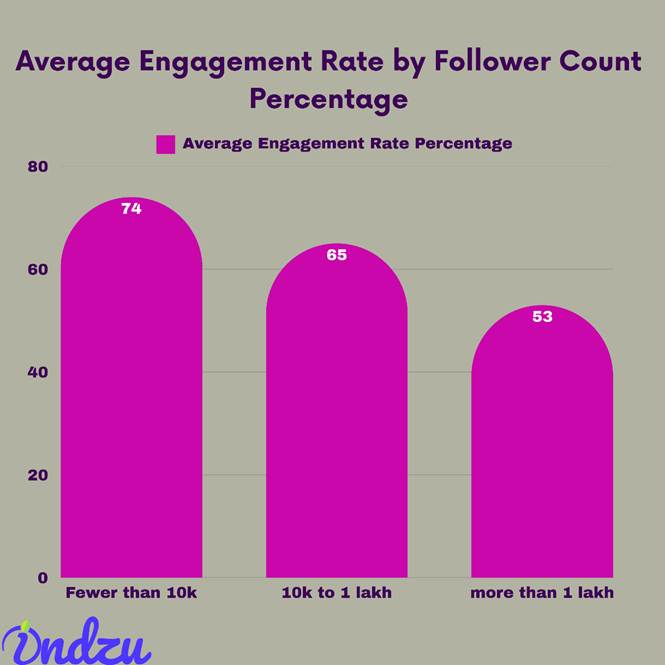
- The engagement rates also depend on the number of followers. Surprisingly, the trend shows that the accounts with more followers have shown less engagement.
This table shows the engagement trend according to follower count in 2024. (Source- oberlo)
| Number of Followers | Average Engagement Rate (%) |
|---|---|
| Fewer than 10,000 followers | 0.74% |
| 10,000 to 100,000 followers | 0.65% |
| More than 100,000 followers | 0.53% |
- Instagram Reels get an average engagement of 6.59% to 8.77%. ( it also depends on the number of followers) (Source- backlinko)
| Number of Followers | Instagram Reels Engagement Rate (%) |
|---|---|
| 100K–500K | 6.59% |
| 500K–1 million | 6.68% |
| 1 million–5 million | 6.15% |
| 5 million–10 million | 7.49% |
| 10+ million | 8.77% |
- The average number of views for Instagram Reels (various accounts & industries) is 120,917. (Source- backlinko)
- On average, video posts get more engagement than photo posts. (Source- backlinko)
| Metric | Value |
|---|---|
| Average comments on video posts | 150 |
| Average comments on image posts | 65 |
| Average comments on carousel posts | 80 |
- Instagram stories are also a hit among youngsters (Source- backlinko)
| Metric | Value (%) |
|---|---|
| Percentage of Gen Z (ages 15–26) watching Stories | 78.01% |
| Percentage of US creators using Stories for sponsored content | 98.1% |
The primary source of income for Instagram is Ads and In-app purchases. (Source-whop)
Speed · 10-minute setupOne coffee from URL to a full month of scheduled posts.
Drop your URL, brew your coffee, come back to 30 brand-on captions ready to publish.
By Revenue
| Year | Revenue (in Billions USD) |
|---|---|
| 2015 | 0.5 |
| 2016 | 2 |
| 2017 | 4 |
| 2018 | 10 |
| 2019 | 19 |
| 2020 | 27 |
| 2021 | 48 |
| 2022 | 51 |
| 2023 | 60 |
Blank tab. Six open browsers. No clue what to post.
After · With IndzuPaste one URL. Get 30 scheduled posts.
By App Downloads
- Instagram app has been downloaded approximately 3.8 billion times, making itself the 4rth most downloaded app(as of 2025)
- It was the 6th most searched term on Google, having 414 million searches/per month.
- In 2024, Instagram had 696 million downloads. (Source- saasworthy)
- In 2022, Instagram had 547 million downloads, which was the highest app download number. (Source-alertify)
- USA is currently at the top in the list when it comes to Instagram app downloads 110 million users (Source-earthweb)
Time killer · Pain
Spending 6 hours writing posts that get zero traction?
Paste your URL. ZuAI turns it into 30 brand-on captions in 10 minutes — no blank-page panic, no generic AI filler.
By Businesses Using Instagram
The following table shows the data of businesses present on Instagram (Source- searchenginejournal, alertify)
| Metric | Value |
|---|---|
| Number of active businesses on Instagram | Over 200 million |
| Percentage of users following at least one business | 90% |
| Percentage of users researching brands or products | 62.4% |
| Percentage of users receptive to ads on videos | 70% |
| Average posts per day by business accounts | 1.55 posts |
| Increase in brand awareness reported by businesses | 30% |
| Boost in website traffic reported by businesses | 23% |
| Percentage of businesses using influencers | 63% |
Outcome · RecommendedGet 30 days of social content from your website — in 10 minutes.
By Marketers Using Instagram
- Researching and following brands is the 3rd most popular activity on Instagram.
- 62.7% of Instagram users research or follow brands and products on Instagram
- In 2020, 26% of Instagram users made social commerce purchases.
- If any marketer uses an Instagram story, the chances of users watching the complete story is 87.2% (higher than any other platform)
- Here is the table showing Instagram and Shopping Behaviour (Source-elfsight, metricool)
| Metric | Value |
|---|---|
| Percentage of shoppers using Instagram for purchases | 70% |
| Percentage of users influenced by Instagram content | 72% |
| Percentage of users who bought something directly from an ad | 33% |
| Percentage of consumers more interested in a brand after seeing it in Stories | 58% |
- Here the table shows the US people’s behaviour on Instagram (Source-elfsight, metricool)
| Metric | Value |
|---|---|
| Percentage of users using Instagram as a search tool | 36% |
| Percentage of U.S. businesses using Instagram | 71% |
| Percentage of U.S. fashion brands using Instagram | 96% |
| U.S. Instagram users checking product reviews | 44% |
| Estimated U.S. users making purchases directly on Instagram (2024) | 46.8 million (35% of U.S. Instagram users) |
| Percentage of U.S. marketers using Instagram | Over 97% |
| Percentage of U.S. marketers using Instagram Reels for influencer marketing | More than 50% |
| Conversion rate for brands using Instagram DMs | 70% |
Proof · Verified
2k+ grew faster with one tool.
By Advertisements on Instagram
- 76% of marketers agree that Instagram Ads give good ROI.
- 30% of the marketers say that Instagram gives them the best ROI. (Source-metricool)
- In 2022, 80% of global marketers used Instagram to advertise their business.
- The table below represents the Instagram ad reach (in millions of users) over time, and the percentage change compared to the previous period. (Source- whop)
| Month / Year | Advertising Reach (in Millions) | Percentage Change vs. Previous Period |
|---|---|---|
| April 2021 | 1,287 | N/A |
| July 2021 | 1,386 | +7.7% |
| October 2021 | 1,393 | +0.5% |
| January 2022 | 1,478 | +6.1% |
| April 2022 | 1,452 | −1.8% |
| July 2022 | 1,440 | −0.8% |
| October 2022 | 1,386 | −3.8% |
| January 2023 | 1,318 | −4.9% |
| April 2023 | 1,628 | +23.5% |
- The table below shows on average how much cost is incurred on an Instagram ad (Source- whop)
| Metric | Cost Range (USD) |
|---|---|
| Cost per click (CPC) | $0 – $0.25 |
| Cost per 100 impressions (CPM) | $0 – $4 |
| Cost per engagement | $0.03 – $0.08 |
Free · Instant · No signupSee what ZuAI generates from your website — right now.
Paste your URL. Watch ZuAI write a month of brand-on captions in seconds. Preview before you create an account.
By Influencer Presence On Instagram
- Instagram is the 2nd best platform for Influencer marketing. 46.7% of brands use Instagram influencer marketing in 2024. (Source-Obrelo)
- 30% of the marketers say that Instagram’s Influencer marketing gives them the best ROI. (Source- sociallypowerful)
- Almost 5 lakh influencers admit that Instagram is the best space for Influencers.
- In 2023, Instagram influencer marketing spending was $1.9588 billion. (Source-metricool)
- Instagram Influencer marketing will reach $22.2 billion by 2025
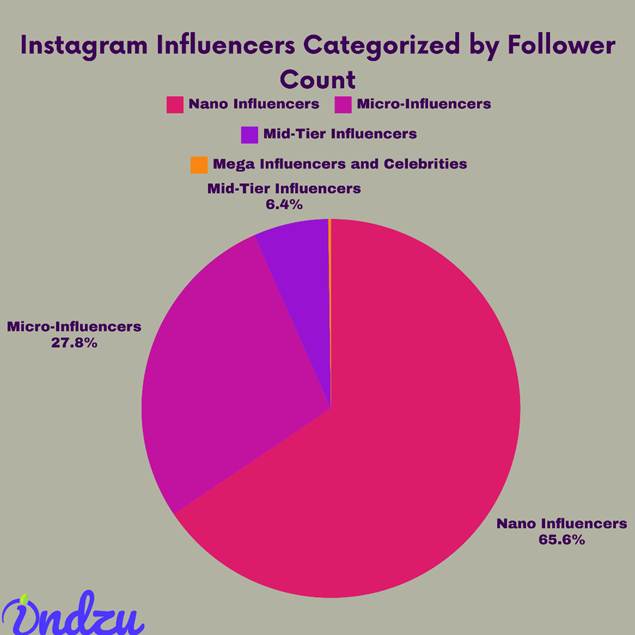
Here is the table showing influencers according to their size and presence on Instagram (Source- sociallypowerful)
| Influencer Category | Followers Range | Presence on Instagram (%) |
|---|---|---|
| Nano Influencers | 1,000 – 10,000 | 65.39% |
| Micro Influencers | 10,000 – 50,000 | 27.73% |
| Mid-Tier Influencers | 50,000 – 500,000 | 6.38% |
| Mega Influencers & Celebrities | More than 1 million | 0.23% |
- Women comprise 77% of influencers. (Source-hubspot)
Here is the data of top influencers and how much they charge per post. (Source- whop)
| Celebrity | Followers (in Millions) | Charge per Post (USD Millions) |
|---|---|---|
| Cristiano Ronaldo | 624 | $3.2 |
| Lionel Messi | 501 | $2.6 |
| Selena Gomez | 430 | $2.6 |
| Kylie Jenner | 400 | $2.4 |
| Dwayne Johnson | 398 | $2.3 |
Speed · 10-minute setupOne coffee from URL to a full month of scheduled posts.
Drop your URL, brew your coffee, come back to 30 brand-on captions ready to publish.
By E-commerce Presence On Instagram
E-commerce and social media are not different. The majority of the population sees so many brands and products on Instagram.
- In 2024,130 Million users have clicked on Instagram shopping posts. (Source- whop)
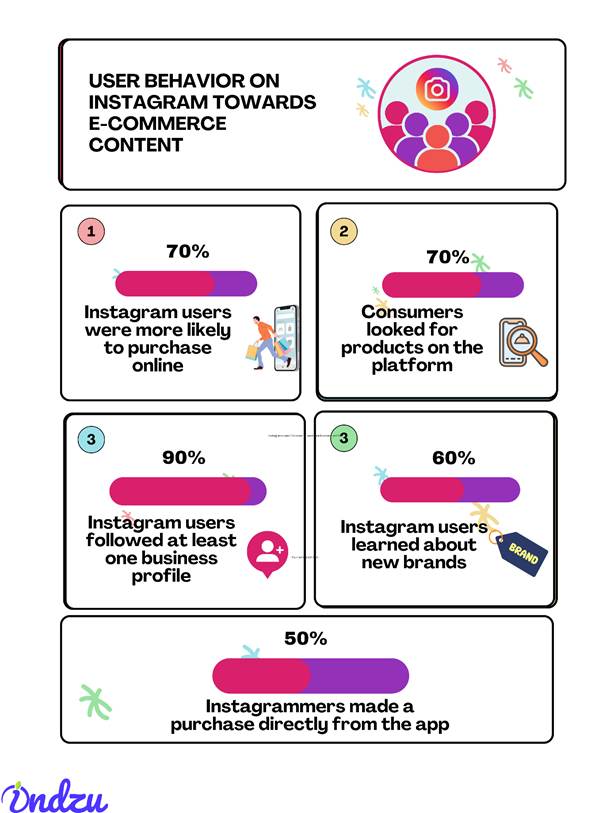
The table shows the data on how Instagram users react to e-commerce content.
| Statistic | Percentage (%) |
|---|---|
| Instagram users more likely to purchase online | 70% |
| Consumers looked for products on the platform | 70% |
| Instagram users followed at least one business profile | 90% |
| Instagram users learned about new brands | 60% |
| Instagrammers made a purchase directly from the app | 50% |
The table shows how Instagram user’s behavior pattern
| Metric | Value |
|---|---|
| The average order value for Instagram shopping | $65 |
| Percentage of users discovering new products through Instagram shopping | 66% |
| Increase in social media sales driven by Instagram shopping | 24% |
| Increase in Instagram shoppable posts (2017–2021) | 1,416% |
| Accounts using tap-to-reveal shopping tag (October 2020) | Over 90 million |
| Total business profiles on Instagram Shopping | Over 25 million |
| Percentage of businesses using the ‘Shop Now’ button | 87% |
Blank tab. Six open browsers. No clue what to post.
After · With IndzuPaste one URL. Get 30 scheduled posts.
By Number Of Employees
As Instagram has been expanding, so has its employee count.
Here is the table showing its growth numbers since 2010. (Source-seo.ai)
| Year | Employee Count | Growth in Numbers | Growth in Percentage |
|---|---|---|---|
| 2010 | 2 | – | – |
| 2011 | 8 | ↑ 6 | ↑ 300% |
| 2012 | 13 | ↑ 5 | ↑ 62.5% |
| 2013 | 50 | ↑ 37 | ↑ 284.6% |
| 2014 | 150 | ↑ 100 | ↑ 200% |
| 2015 | 300 | ↑ 150 | ↑ 100% |
| 2016 | 450 | ↑ 150 | ↑ 50% |
| 2017 | 500 | ↑ 50 | ↑ 11.1% |
| 2018 | 1,000 | ↑ 500 | ↑ 100% |
| 2019 | 3,000 | ↑ 2,000 | ↑ 200% |
| 2020 | 7,000 | ↑ 4,000 | ↑ 133.3% |
| 2021 | 12,000 | ↑ 5,000 | ↑ 71.4% |
| 2022 | 15,000 | ↑ 3,000 | ↑ 25% |
| 2023 | 18,000 | ↑ 3,000 | ↑ 20% |
| 2024 | 20,100 | ↑ 2,100 | ↑ 11.7% |
Time killer · Pain
Spending 6 hours writing posts that get zero traction?
Paste your URL. ZuAI turns it into 30 brand-on captions in 10 minutes — no blank-page panic, no generic AI filler.
Expected Growth Of Instagram
- Instagram is expected to grow by 56% in 2025 as Asia- the Asia-Pacific region will drive many new users to Instagram.
- Instagram has the potential to hit 3 Billion+ users by 2030.
- Instagram’s ad revenue is supposed to grow by $ 240 billion. (Source-expertbeacon.com)
Some Interesting Facts about Instagram
- A major share of Facebook’s revenue comes from Instagram. In 2023, about 36.9 % of Facebook revenue came from Instagram.(Source- businessofapps)
- Instagram is valued at 70.4 billion US dollars as of 2024. (Source-statista)
Outcome · RecommendedGet 30 days of social content from your website — in 10 minutes.
The Ifs, Buts & Pitfalls Of Instagram
- There have been concerns regarding Instagram’s privacy and security policies.
A study found that Instagram collects about 79% of users’ data and shares it with third parties like location, contact, financial info, preferences, etc.
In fact, Instagram has topped the list of invasive apps that collect data and share it with 3rd parties. (Source- independent.co.uk)
- Every social media platform wants users to spend more and more time on its platform, and Instagram has many beautiful and addictive features that allow teens to spend a large portion of their day on Instagram.
- Instagram is filled with Influencers, and people trust them blindly. Some Influencers take advantage of this situation and spread misinformation.
For example- During COVID-19 times, many influencers spread the news of fake vaccines and medicines, which received backlash for this.(Source-opb.org)
- Instagram has been infamous for promoting fake beauty standards. As Instagram has many filters, users try to gain attention by making themselves beautiful.
Surgeons of the American Academy of Facial and Reconstructive Surgery have reported that they received 30% more patients than usual because of social media. (Source- centralrecorder.org)
Proof · Verified
2k+ grew faster with one tool.
If we sum up
It is undeniable that Instagram has become a part of our lives. It has allowed us to be in touch with our friends, new trends, fashion, businesses, influencers, stay updated with the latest happenings of the world, etc.
However, its drawbacks cannot be overlooked as they cause some mental health and privacy issues. However, if Instagram takes steps to curb these issues, things will work fine.
Instagram has given many opportunities to influencers, creators, businesses, and marketers. As we can see from the data above, it has indeed become a powerful company that matters to everyone.