Last updated on
The journey of Google My Business started in 2004 when Google started listing local businesses.
- Google My Business is not a social media platform, but it has social media platform-like features designed for business-customer interaction. It’s more of a business directory with engagement tools.
- Google Search Engine Dominance
| Insight | Data |
| Total Google searches per day | 3.5 billion |
| Google’s search engine market share (US) | 92% |
| Bing’s search engine market share (US) | 3% |
Let us understand the importance of Interesting GMB Stats ( data-backed)
History of Google My Business Stats
Table 1: Major Milestones in Google My Business (GMB) History
| Year | Major Development |
| 2004 | Google introduced “Google Local” as a feature within Google Maps |
| 2005 | Google Local rebranded as “Google Maps for Mobile.” |
| 2009 | Google Places launched, separating business listings from Maps. |
| 2012 | Google+ Local was introduced, integrating Places with Google+. |
| 2014 | Google My Business (GMB) launched, merging Places & Google+ Local. |
| 2017 | Google Posts launched, allowing direct business updates. |
| 2018 | Enhanced analytics capabilities introduced in GMB. |
Table 2: Feature Rollouts in GMB (2017 – 2021)
| Date | Feature Introduced |
| Jul 2017 | Messaging feature launched for GMB. |
| Oct 2017 | Booking button added to business listings. |
| Jan 2018 | GMB Posts started appearing on Google websites. |
| Mar 2018 | Business Description field updated; Women-Led attribute added. |
| Apr 2018 | Businesses could now specify a custom list of services. (like services provided, products available, etc.) |
| Oct 2018 | Follow button added to Google My Business listings. |
| Nov 2018 | Future opening date listings introduced (90 days before opening). |
| Jan 2019 | Social media icons added to GMB Knowledge Panels. |
| Apr 2019 | GMB dashboard redesigned for better user experience. (A dashboard was created and buttons like Home, Insights, Posts, etc. were added) |
| Jun 2019 | Branding & promotional tools added for businesses. .(like logo, cover photo, welcome offers) |
| Jul 2019 | The “Get A Quote” button was added to GMB Knowledge Panels. |
| Nov 2019 | Businesses could add a custom list of services to GMB listings. (like provides 1 day delivery, provides nursing facilities, etc.) |
Number Of Countries Using GMB
- GMB is available in 245 countries.
- But it is not available in 7 countries.
- Crimea
- Cuba
- Iran
- North Korea
- Sudan
- Syria
- China
(Source- GoogleSupport)
Features Of Google My Business
Here is the table showing Basic Information Features in GMB
| Feature | Details |
| Business Name | Accurate and consistent with branding. |
| Address | Physical location including street address, city, state, and zip code. |
| Phone Number | Primary contact number for customers. |
| Website | Link to your official website. |
| Category | Primary category that best describes your business. |
| Additional Categories | Up to 10 more categories to further define your offerings. |
| Description | Brief overview of business and offerings. |
| Hours of Operation | Regular business hours, including special and holiday hours. |
Enhancement Features in GMB
| Feature | Details |
| Photos | Upload images of the business interior, exterior, products, and team. |
| Videos | Share videos showcasing businesses, products, or services. |
| Attributes | Highlight specific features (e.g., “outdoor seating,” “wheelchair accessible”). |
| Menu (for restaurants) | Display menu items with descriptions and prices. |
| Products | Showcase products with images, descriptions, and prices. |
| Services | List services offered with descriptions and pricing (if applicable). |
| Appointment Link | Provide a direct link for customers to book appointments. |
Engagement Features in GMB
| Feature | Details |
| Reviews | Encourage and respond to customer reviews (positive and negative). |
| Questions & Answers | Answer frequently asked customer questions. |
| Messaging | Enable direct customer messaging through GMB. |
| Google Posts | Create and share updates, offers, events, and announcements. |
Special Features and Business Management in GMB
| Feature | Details |
| Insights | Track customer interactions (how they find business, actions taken, etc.). |
| Location Management | Manage multiple business locations from one account. |
| User Management | Add and manage users with different access levels. |
| Online Ordering (for restaurants) | Enable customers to order food online. |
| Reservations (for restaurants) | Allow customers to make reservations. |
| Special Hours | Set different hours for specific days or events. |
Businesses Categories Present On Google My Business
- Google offers 4000 categories and one can choose 10 categories for Business listing
Verified Businesses Present On Google My Business
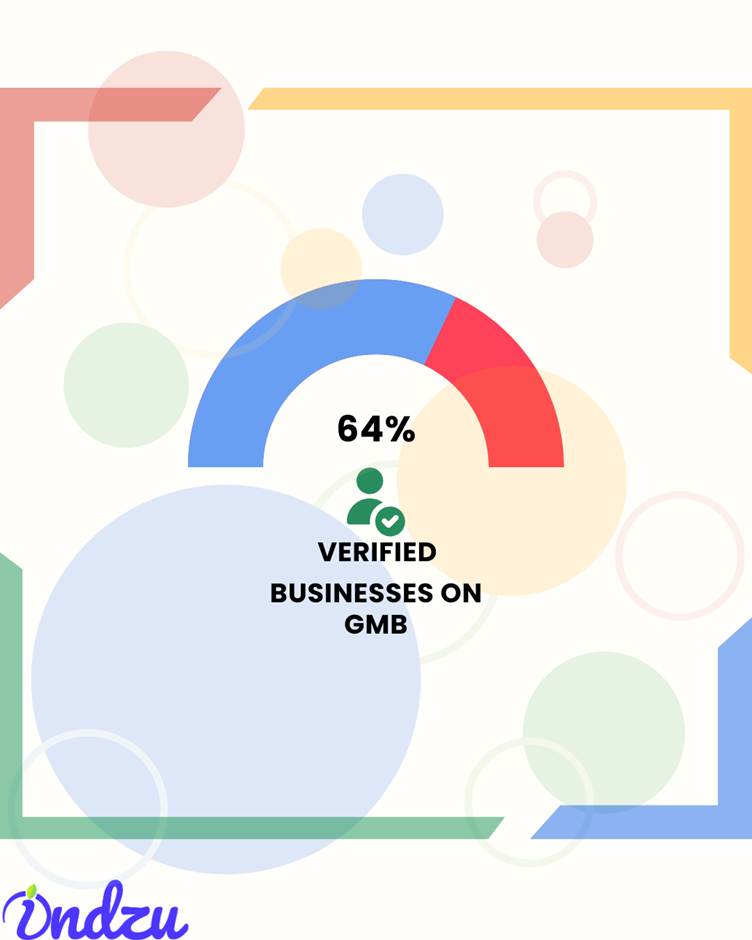
- Out of all businesses posted on Google My Business, 64% of them are verified.
- Verified Businesses have more chances of visibility.
Here is the table showing the Percentage of Verified Businesses on Google My Business (GMB) by Industry
| Industry | Verified GMB Profile (%) |
| Property Management | 83% |
| Hospitality | 81% |
| Healthcare | 75% |
| Retail | 73% |
| Technology | 70% |
| Consumer Goods | 69% |
| Beauty & Wellness | 65% |
| Finance | 65% |
| Recreation | 58% |
| Legal | 57% |
| Automotive | 45% |
| Home Services | 45% |
Here is the table showing Verified Businesses – Monthly Engagement Metrics
| Metric | Value |
| Average direction requests per month | 66 |
| Industries leading in direction requests | Hospitality, Recreation |
| Average calls generated per year | 595 |
| Average calls generated per month | 50 |
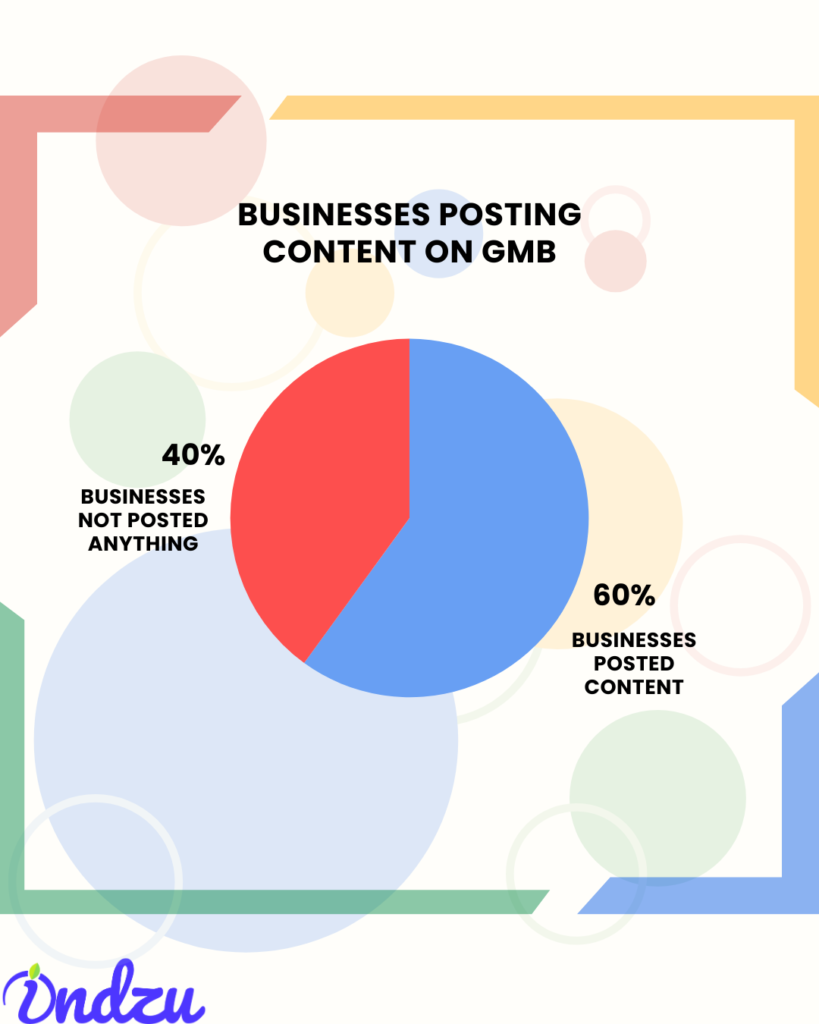
Businesses Posting Content On GMB
Businesses improve their online visibility and credibility by posting content
This table shows Business Posting Content on Google Business Profile (GMB)
| Posting Activity | Percentage of Businesses |
| Businesses that have posted content | 60% |
| Businesses that have not posted anything | 40% |
Businesses Posting Photos On GMB
Businesses improve their online visibility and credibility by posting photos.
- It has been reported that there is an Increased revenue per visitor by 17% if images are posted on GMB
This table shows the Number of Photos per Business Profile by Industry
| Industry | Average Number of Photos |
| Home Services | 70 |
| Automotive | 57 |
| Beauty & Wellness | 44 |
| Technology | 19 |
| Healthcare | 12 |
| Finance | 6 |
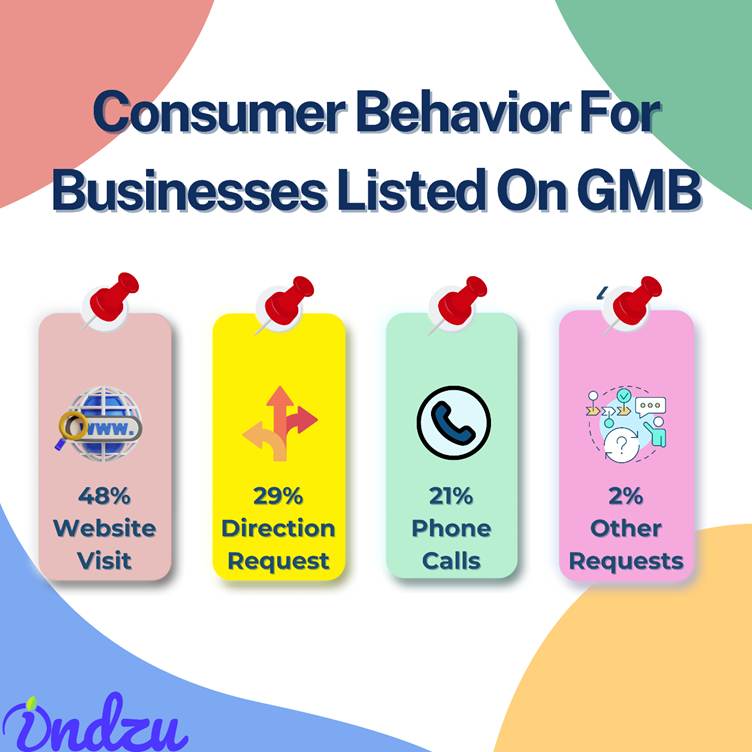
Consumer Behavior For Businesses Listed On GMB
The table shows how people have Google Business Profile Interactions
| Interaction Type | Percentage (%) |
| Website Visits | 48% |
| Direction Requests | 29% |
| Phone Calls | 21% |
| Other Interactions | 2% |
Consumer Looking For Directions Via GMB
This table shows GMB and Google Maps Visibility
| Insight | Data |
| Consumers using Google Maps to locate a nearby business | 86% |
| Consumers using Google Maps to find a business | 93% |
Businesses Getting Traffic To Their Websites Via GMB
- The Businesses that list images on GMB receive 35 times more website visits than others (who do not post images)
This table shows the Website Visits from Google Business Profile by Industry
| Industry | Website Visits |
| Automotive | 3,840 |
| Beauty & Wellness | 1,866 |
| Consumer Goods | 1,319 |
| Finance | 203 |
| Healthcare | 515 |
| Home Services | 402 |
| Hospitality | 4,702 |
| Legal | 406 |
| Property Management | 1,689 |
| Recreation | 6,830 |
| Retail | 1,582 |
Businesses Getting Google Search Views Via GMB
This table shows Google Search Views from Google Business Profile by Industry
| Industry | Google Search Views |
| Hospitality | 92,626 |
| Recreation | 81,169 |
| Automotive | 41,013 |
| Retail | 40,489 |
| Consumer Goods | 21,643 |
| Property Management | 18,349 |
| Beauty & Wellness | 17,234 |
| Healthcare | 11,276 |
| Home Services | 8,754 |
| Legal | 7,166 |
| Technology | 6,431 |
| Finance | 5,358 |
Businesses Getting Engagement And Conversions Via GMB
This Table Shows Engagement & Customer Actions on GMB
| Insight | Data |
| Percentage of businesses receiving appointment requests through GMB | 45% |
| Percentage of GMB listings with an appointment scheduler leading to approvals | 45% |
| Percentage of customer actions resulting in website visits | 56% |
| Conversion rate from Google Business Profile views into actual customer actions | More than 5% |
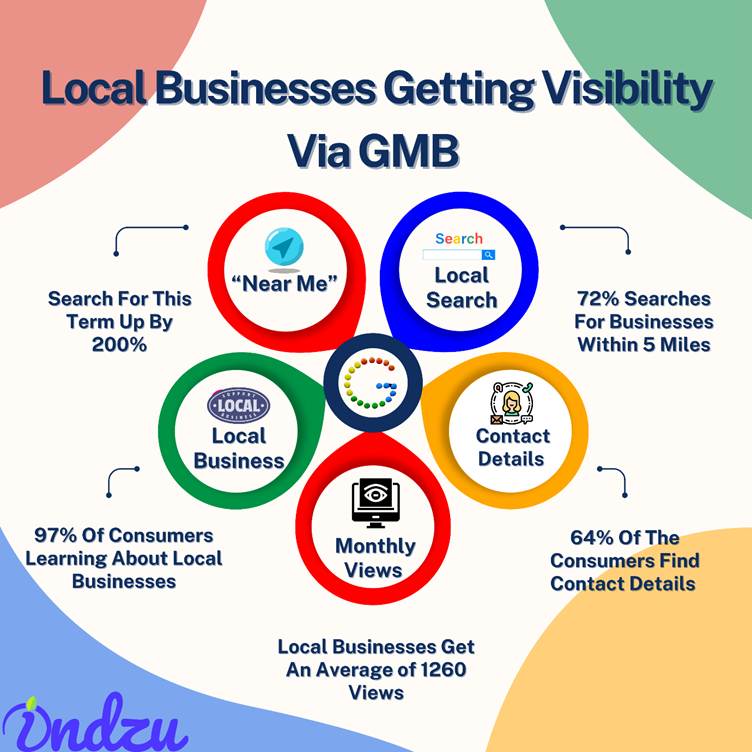
Local Businesses Getting Visibility Via GMB
- When people search for local businesses on Google, 42% of them click on one of the results displayed in the Google Local Pack.
This Table Shows how GMB Helps Local Businesses
| Insight | Data |
| Percentage of local business calls received on weekdays | 94% |
| Surge in “Near Me” search queries | Over 200% |
| Local searchers visiting businesses within 5 miles | 72% |
| Percentage of consumers learning about local businesses online | 97% |
| Consumers using GMB to find contact details | 64% |
| Average monthly views for a local business on GMB | 1,260 |
Businesses Getting Business Visibility & SEO
Importance of GMB for Business Visibility & SEO
| Insight | Data |
| Percentage of internet searches done on Google | 90% |
| Average actions per month per business (calls, clicks, conversations) | 59 |
| Percentage of interactions leading to website visits | More than 50% |
| Importance of online presence | 97% of users learn about businesses online |
| Percentage of businesses receiving over 1,000 views per month | 40% |
| Impact of accurate & complete GMB information | 7x more clicks |
Businesses Getting User Reviews On Their GMB Profile
- A Business gets an average of 39 reviews on a GMB Profile.
This Table Shows Google Reviews by Industry
| Industry | Number of Reviews |
| Automotive | 150 |
| Beauty & Wellness | 48 |
| Consumer Goods | 63 |
| Finance | 23 |
| Healthcare | 60 |
| Home Services | 47 |
| Hospitality | 281 |
| Legal | 36 |
| Property Mgmt. | 34 |
| Recreation | 140 |
| Retail | 97 |
Consumer Behavior Trends for Google Business Reviews
This Table Shows Consumer Review Insights
| Insight | Percentage / Value |
| Average new Google reviews per location in 2023 | 66 |
| Consumers likely to give a review after a positive experience | 65% |
| Consumers who will give a review when asked | 68% |
| Consumers expect a response within 60 minutes | 42% |
| Consumers expect a response on weekends or nights | 67% |
| Customers are likely to provide a review if a business resolves an issue positively | 79% |
- However, businesses are also affected by negative reviews. Negative reviews can deter potential customers by 45 times.
Consumer Behavior Getting Influenced By GMB Profile
This Table Shows Consumer Behavior & GMB Influence
| Insight | Data |
| Consumers who read online reviews before choosing a local business | 82% |
| Consumers who used Google to decide on a business in 2022 | 87% |
| Consumers who read reviews before making a purchase | 90% |
| Customers are likely to shop if business owners respond to reviews | 88% |
Effectiveness of GMB Ads for Businesses
GMB Ads Statistics
| Insight | Percentage / Value |
| Pay-per-click ads viewed on mobile devices | 50% |
| Average actions per month from a business listing (calls, clicks, conversations) | 59 actions |
| Consumers are likely to visit a store after seeing an ad on Google | 70% |
The Ifs, Buts & Pitfalls Of GMB
- Due to Google’s algorithm changes, sometimes business rankings are impacted by GMB.
- A negative review on GMB can affect a business’s conversion rates. Companies need to respond wisely to Google reviews.
- There are a large number of Businesses that list themselves on GMB, and there is massive competition among businesses to rank well.
- Limited customization options are available on GMB, and giving complete information to customers is sometimes difficult for some businesses.
- Businesses must constantly optimize their GMB profiles and check for inaccurate information or reviews users post.
If We Sum Up
GMB profiles can generate a lot of engagement and business interactions. Several positive reviews can also shape customers’ mindsets and bolster conversions.
A good GMB profile is one of the best ways to target local customers; hence, no business should miss this opportunity.
Do you want to know other social media stats? Check out our other blogs.
- (Source-adbirt, themediacaptain, slickkestdigital, e2msolution, coolest-gadget), publer)
Share this article


More To Explore
 Social
What Is Social Media Management A Beginner’s Guide
Are you feeling exhausted by doing multiple logins and logouts to manage your social media...
July 12, 2025 Social
How to make an Instagram Story poll?
Want more engagement on your Instagram story in just one tap? You can create Instagram...
July 11, 2025 Social
5 Things You Didn’t Know A Social Media Tool Could Do
91% of entrepreneurs and businesses use social media for marketing to build their brand and...
July 11, 2025 Social
Social listening – What is it and Why it matters in 2025?
If you casually search for some space-saving furniture on a social media platform one fine...
July 9, 2025 Social
Why Most Social Media Management Tools Get Social Media Analytics Wrong – And How to Fix It
Why do most Social Media tools get Social Media Analytics wrong? Simple – they report...
July 8, 2025 Social
How Much Does YouTube Pay for 1 Million Views?
We often see people earning highly from YouTube. YouTubers boast high-end interiors, costly cars, and...
July 3, 2025 Social
How to delete a comment on Instagram?
Did your friend roast you under one of your Instagram posts? That’s what friends do:...
June 25, 2025 Social
How to delete Instagram account?
You want to stay away from Instagram and delete your account. Or you always think...
June 23, 2025 Social
How to clear Instagram cache?
Is your Instagram slowing down, or are you experiencing a glitch? Learn how to clearInstagram...
June 18, 2025 Social
Why can’t I follow people on Instagram?
Everything is just going fine. You gain some new friends on Instagram. This feels so...
June 16, 2025 Social
How to turn off Meta AI on Instagram
Meta AI was launched on Instagram in April 2024. When many people found it amazing...
June 12, 2025 Social
Best Instagram Reel length for Maximum Engagement
Instagram Reels have become a cornerstone of content marketing on the platform. This blog explores...
June 9, 2025 Social
How many Instagram accounts can I have?
Do you want to have another Instagram account? Do you feel it’s necessary to have...
June 3, 2025 Social
Tips for Evaluating Social Media Tools During Free Trials
4.89 billion people are using social media across the globe and nearly every individual is...
June 2, 2025 Social
Does Facebook notify when you screenshot a story?
Wondering does Facebook notify when you screenshot a story? The simple answer is no. Facebook...
June 2, 2025 Social
What is the meaning of Instagram user?
Just yesterday, you saw the real user’s name in the DM section, and now you...
May 31, 2025 Social
Why can’t I add music to my Instagram post?
Music is a game changer in content; music can direct our mood and enter directly...
May 28, 2025 Social
What is Quiet Mode On Instagram?
Is there any way you can be on Instagram but not be there at the...
May 22, 2025 Social
What are Impressions on LinkedIn?
Are you posting on LinkedIn to gain more reach and popularity? While you are posting,...
May 13, 2025 Social
Is LinkedIn Premium worth it?
If you see your friend subscribing to LinkedIn Premium and wonder if you could manage...
May 13, 2025 Social
How to change an Instagram password?
Did your friend find out your Instagram password? Here’s how to change an Instagram password...
May 13, 2025 Social
How to get more followers on Instagram?
Done everything? Have you tried all the hacks? Posted all kinds of content? Improved content...
May 12, 2025 Social
How to see if someone unfollowed you on Instagram?
Just some days before, you saw many followers on Instagram, but now you see that...
May 7, 2025 Social
How to block someone on LinkedIn?
Some people do not understand the value of your time; they will constantly send irrelevant...
May 7, 2025 Social
How to download Instagram videos?
You just saw an Instagram reel using the Insta app, and now you want to...
May 6, 2025 Social
Instagram Video Length: Let Us Debug How long can a video be on Instagram?
You saw others posting long videos on Instagram and thought you could do the same,...
May 2, 2025 Social
How to change your name on Instagram
Want to rebrand your Instagram? Learn how to change your name on Instagram! Instagram is...
May 1, 2025 Social
How do you tag someone on Instagram?
You came across relatable content on Instagram, and you want to tag your bestie, but...
April 30, 2025 Social
How to see who shared your Instagram post.
Did you see your post on someone else story and wonder how to see who...
April 29, 2025 Social
All Social Media Stats Research
Social Media Stats Social media was initially created to improve communication among people and make...
March 25, 2025 Social
21 Interesting Stats you need to know about YouTube
Are you a business, looking to grow on YouTube? Or are you a content creator,...
March 17, 2025 Social
TikTok by the Numbers: Must-Know Stats to Dominate in 2025
Most Important TikTok Stats: TikTok is a social media platform that revolutionized social media platforms....
March 12, 2025 Social
19 Most Important Pinterest Statistics
Many users think that Pinterest is a search engine or the hub for new ideas...
March 12, 2025 Social
What Does Restricting Someone on Instagram Do?
It is a beautiful day, and you want to spend your energy on positive things....
March 11, 2025 Social
How to see and recover deleted messages on Instagram?
You were doing something, and Instagram messages got deleted mistakenly, or you were just in...
March 11, 2025 Social
How to hide followers on Instagram
A lot of your friends, relatives, or colleagues are likely on Instagram. However, you might...
March 11, 2025 Social
22 interesting stats about LinkedIn
Interesting LinkedIn stats: Are you planning to use LinkedIn for your business? Do you wish...
March 11, 2025 Social
How to Change Background Color on Instagram Story
You may not be able to change your life overnight, but at least you can...
March 11, 2025 Social
Essential Instagram Stats You Need to Know in 2025
Do you think of purchasing something and search for it on Instagram before purchasing? Instagram’s...
March 11, 2025 Social
Interesting Facebook Stats- You Can’t Ignore in 2025
No one needs an introduction to Facebook, but many people would be surprised to know...
March 10, 2025 Social
Does instagram notify screenshots when you screenshot a story, post, or direct message?
Have you ever wondered does instagram notify screenshots when you screenshot a story, post, or...
March 9, 2025 Social
Can you see who views your Instagram profile, story, and post?
Getting curious about how can you see who views your Instagram profile, story, and post....
March 8, 2025