Last updated on
Many users think that Pinterest is a search engine or the hub for new ideas and creativity. However, Pinterest is the world’s 15th most popular social media platform and the most popular visual search engine. In this blog, we will get to know about the 19 interesting Pinterest Statistics.
If you are a business looking for marketing, a creator seeking growth, an influencer, or a curious person seeking some ideas or products, Pinterest will help you with everything.
In this blog, we will cover the 20 most essential Pinterest statistics and understand why posting pins on Pinterest will be beneficial in the coming days.
By History
Ben Silberman & Paul Sciarra started an app, Tote, for mobile shopping on iPhone. But it could not gain much popularity. However, the founders noticed that
- People liked a particular feature of the app: saving their favorite products and mailing them to themselves.
- People searched by product category and not by brands.
This made the founders work on a platform that could allow users to organize or pin their favorite products into buckets.
Hence, combining pin & interest, Pinterest was born.
Here’s the table showing the history of Pinterest
(Source- qqtube.com, calvyn.com)
| Year/Date | Event Description |
| March 2010 | Pinterest is founded in San Francisco as a closed beta. |
| December 2011 | Rapid growth, reaching 10 million unique visitors. |
| August 2012 | Pinterest was launched to the public. |
| 2013 | Rich Pins introduced. |
| March 2014 | Pinterest announces a $200 million funding round, valuing the company at $5 billion. |
| April 2015 | Promoted Pins are launched, allowing advertising revenue. |
| June 2015 | Buyable Pins are launched. |
| 2016 | Pinterest reaches 150 million monthly active users. |
| 2017 | The company launches “Lens,” a visual search tool to identify and find similar items or related boards. |
| 2019 | Pinterest announces IPO, solidifying its status as a major social media player. |
By Countries Using Pinterest
Pinterest is being used by 200 or more nations (approximately). This table shows the Pinterest data for each country as of April 2024. (Source-statista)
| Country | Audience Size (in millions) |
| United States | 89.9 |
| Brazil | 38.93 |
| Mexico | 24.68 |
| Germany | 19.33 |
| France | 17.33 |
| United Kingdom | 14.68 |
| Italy | 10.45 |
| Argentina | 10.38 |
| Canada | 10.05 |
| Colombia | 9.58 |
| Spain | 9.58 |
| Japan | 8.52 |
| Netherlands | 6.38 |
| Australia | 5.51 |
| Chile | 4.98 |
| Poland | 3.37 |
| Belgium | 2.98 |
| Romania | 2.7 |
| Portugal | 2.65 |
| Sweden | 2.62 |
- The USA has the highest number of Pinterest users, with 95.6 million
- Out Of the 10 countries on the list, 6 are from the Americas, and the remaining four are from Europe.
By regions using Pinterest
America loves Pinterest the most. Here is the table showing the data of users region-wise. (source-ecwid)
| Region | Pinterest Users (in millions) |
| Northern America | 93.0 |
| Southern America | 44.7 |
| Western Europe | 37.1 |
| Caribbean | 0.537 (537 thousand) |
| Western Asia | 0.216 (216 thousand) |
Here is the table showing the users in America and outside America year-wise. (Source- growthdevil)
| Year | The United States of America | Outside USA(International) |
| 2024 | 90 million | 432 million |
| 2023 | 97 million | 401 million |
| 2022 | 95 million | 355 million |
| 2021 | 86 million | 346 million |
| 2020 | 98 million | 361 million |
| 2019 | 88 million | 247 million |
| 2018 | million | 184 million |
By the number of users using Pinterest
- There are 537 million monthly active users on Pinterest (Source-demandsage)
- It is used by around 6.4% of the world’s population(Source-adamconnell)
- Pinterest has one of the highest customer satisfaction scores. With a score of 74/100 (among online network companies), it scores according to the American Customer Satisfaction Index (ACSI).
- Pinterest is the 15th most loved social media platform. (Source-demandsage)
Here is the table showing the monthly active users year-wise. (Source-demandsage)
| Quarter | Monthly Active Users Of Pinterest |
| Q4 2024 | 537 million |
| Q2 2024 | 522 million |
| Q1 2024 | 518 million |
| Q4 2023 | 498 million |
| Q3 2023 | 482 million |
| Q2 2023 | 465 million |
| Q1 2023 | 463 million |
| Q4 2022 | 450 million |
| Q3 2022 | 445 million |
| Q2 2022 | 433 million |
| Q1 2022 | 433 million |
By Gender
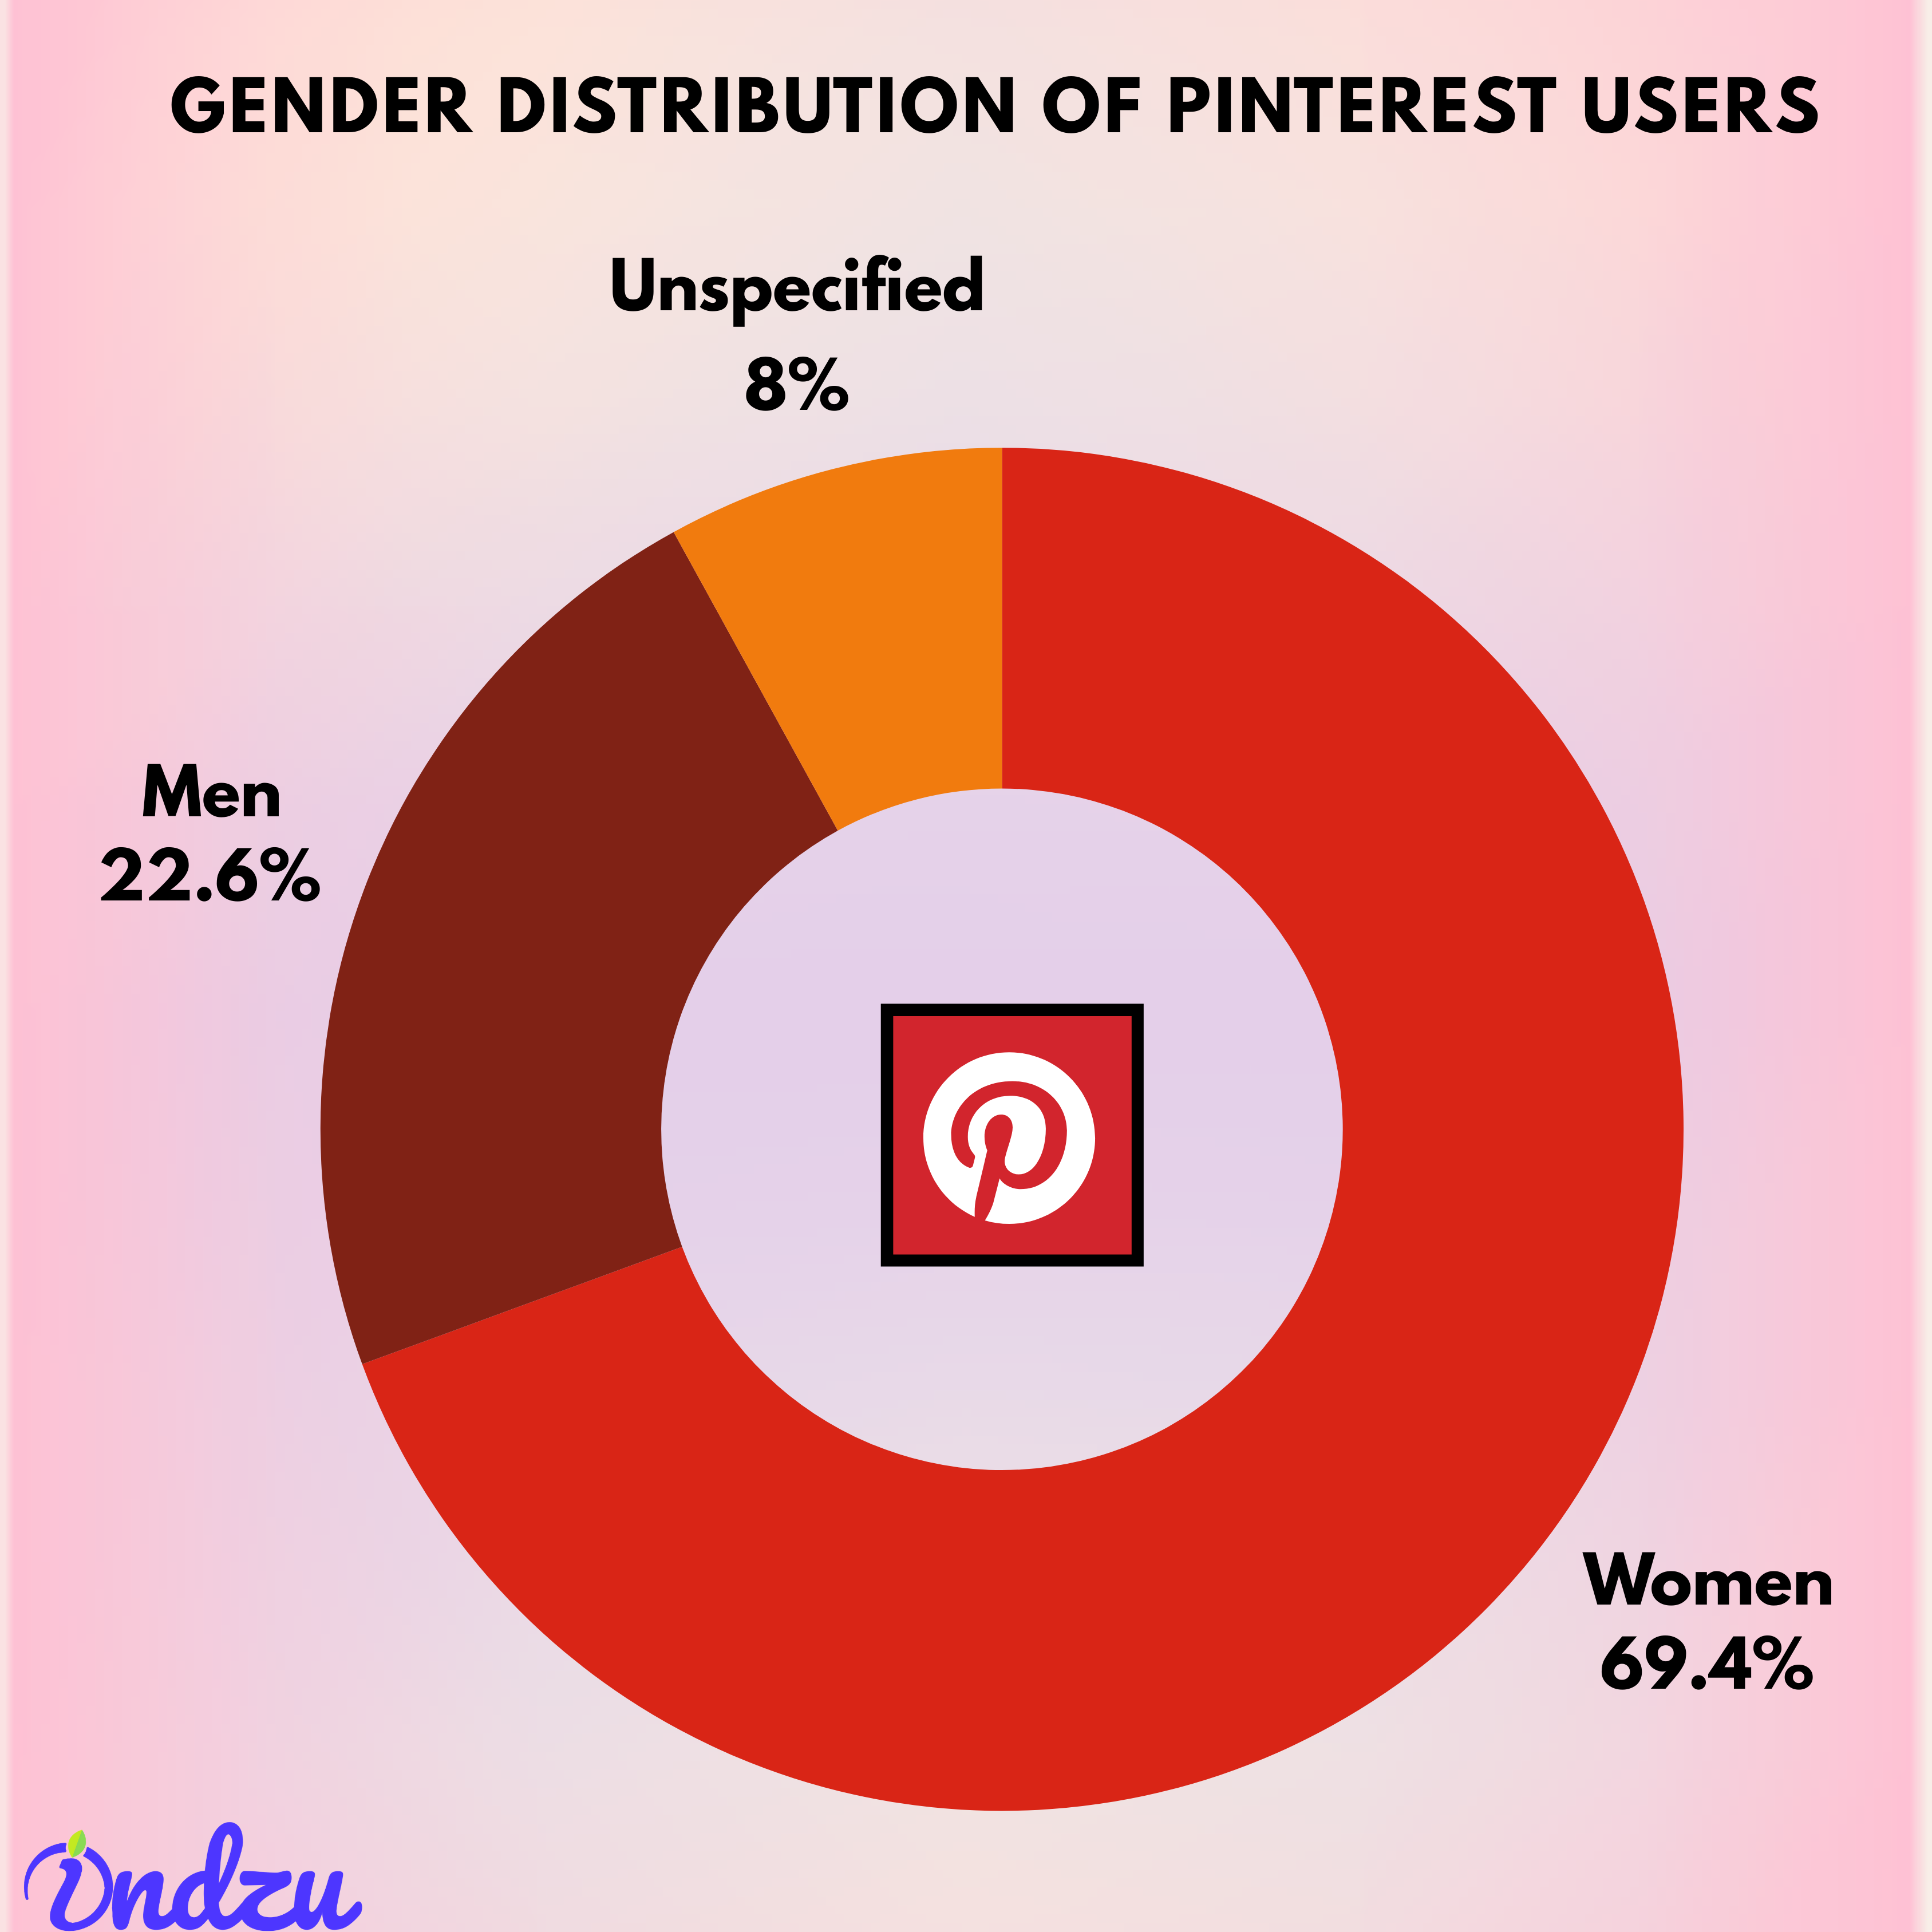
It is known that Pinterest Is widely popular among females.
Here is the table showing how Pinterest is used among genders (Source-demandsage)
| Gender | Percentage of Pinterest Users | Number of Users (in thousands, assuming 100,000 total users) |
| Women | 69.4% | 69,400 |
| Men | 22.6% | 22,600 |
| Unspecified | 8.0% | 8,000 |
By time spent
- Pinterest successfully established itself as a visually appealing platform. The table shows the time spent and the platform’s opening rate
(Source-adamconnell)
| Metric | Value |
| Average time spent per month | 1 hour 49 minutes |
| Average session duration | 2 minutes 11 seconds |
| Average app openings per month | 50 times |
| Percentage of users opening daily | 27.2% |
By Age
Pinterest is prevalent among millennials and Gen-Z. This table shows data on different age groups using Pinterest. (Source-demandsage)
| Age | Percentage Of Users |
| 18 to 24 years | 29.6% |
| 25 to 34 years | 27.3% |
| 35 to 44 years | 18.1% |
| 45 to 54 years | 11.1% |
| 55 to 64 years | 8.5% |
| Above 65 years |
Here the table shows the popularity of Pinterest among various age groups in the USA.(Source-adamconnell)
| Age Group | Percentage of Users in the US (%) |
| 18-24 (Gen Z) | 46% |
| 25-34 | 40% |
| 35-44 | 39% |
- There are approximately 25 million Gen Z user in the USA (Source-analyzify)
By Purpose Of Use
The most popular reason for using Pinterest is to search for Brands and Products. The table shows the approximate percentage of reasons why Pinterest is used.
(Source-DataReportal, –adamconnell)
| Activity | Percentage (%) |
| Entertaining content | ~20% |
| Brands & products | ~40% |
| New & current events | ~15% |
| MSG family | ~10% |
| Post or share | ~10% |
- Pinterest is very popular among creatives and hobbyists. More than 90% of users said it’s where they go when they’re about to start work on a new project, whether that be DIY, home improvement, arts and crafts, or anything else.(source-adamconnell)
By Engagement
- A Good Engagement Rate On Pinterest Is Around 1% To 2%
- Videos are more popular on Pinterest. Video views have increased by 200%
- Short-form videos are more popular on Pinterest. 73% of users said that they liked short-form videos more on Pinterest. (Source- growthdevil)
- Here is the table showing more data about Pinterest engagement.
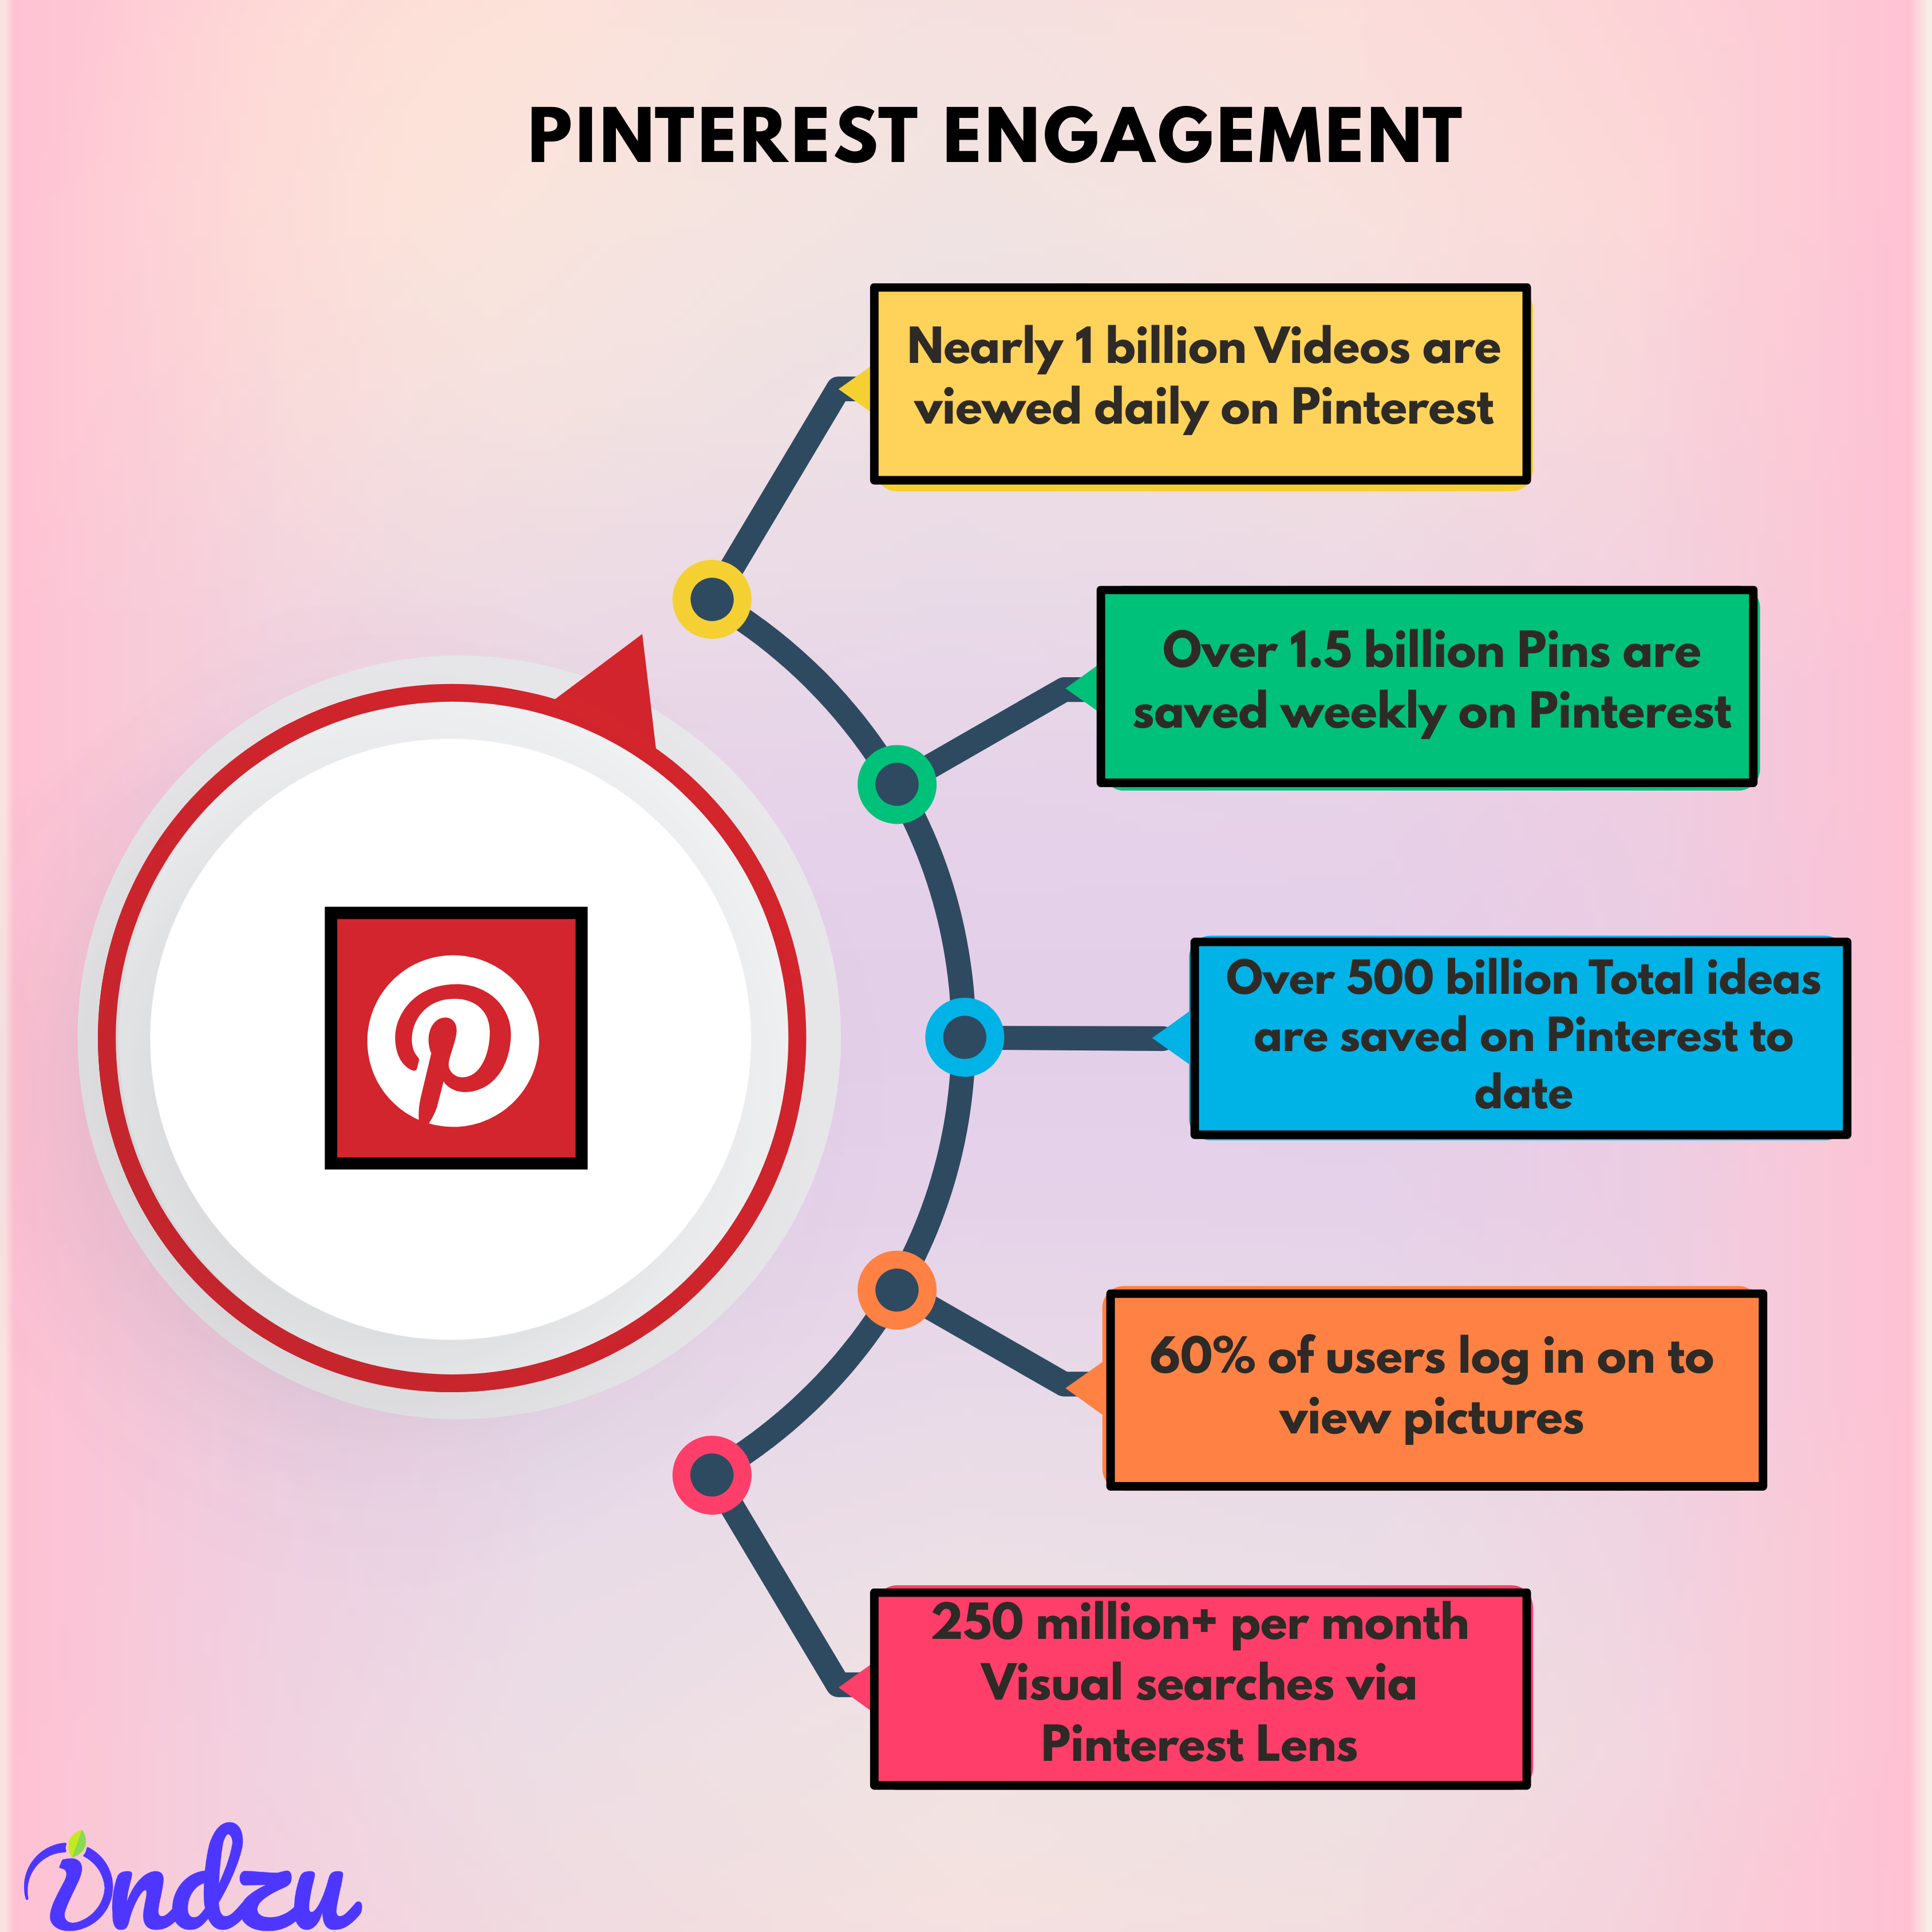
(Source-socialpilot)(Source-adamconnell)
| Metric | Value |
| Videos viewed daily on Pinterest | Nearly 1 billion |
| Pins saved weekly on Pinterest | Over 1.5 billion |
| Total ideas saved on Pinterest to date | Over 500 billion |
| Users logging on to view pictures | 60% of users |
| Visual searches via Pinterest Lens | 250 million+ per month |
- The fashion and home decor industry has higher engagement rates than other industries
- Visually appealing content gets more engagement on Pinterest.
By Revenue
- Pinterest could generate heavily from Brands Running Advertisement Campaigns In 2023.
The table below shows the revenue of Pinterest in years.)(Source-demandsage)
| Year | Revenue |
| 2024 (Q1+Q2) | 1.594 billion |
| 2023* | 3.055 billion |
| 2022 | 2.802 billion |
| 2021 | 2.577 billion |
| 2020 | 1.693 billion |
| 2019 | 1.142 billion |
| 2018 | 0.755 billion |
| 2017 | 0.507 billion |
| 2016 | 0.299 billion |
By Business & Marketing Usage
- People on Pinterest are keener on searching about a product rather than a brand
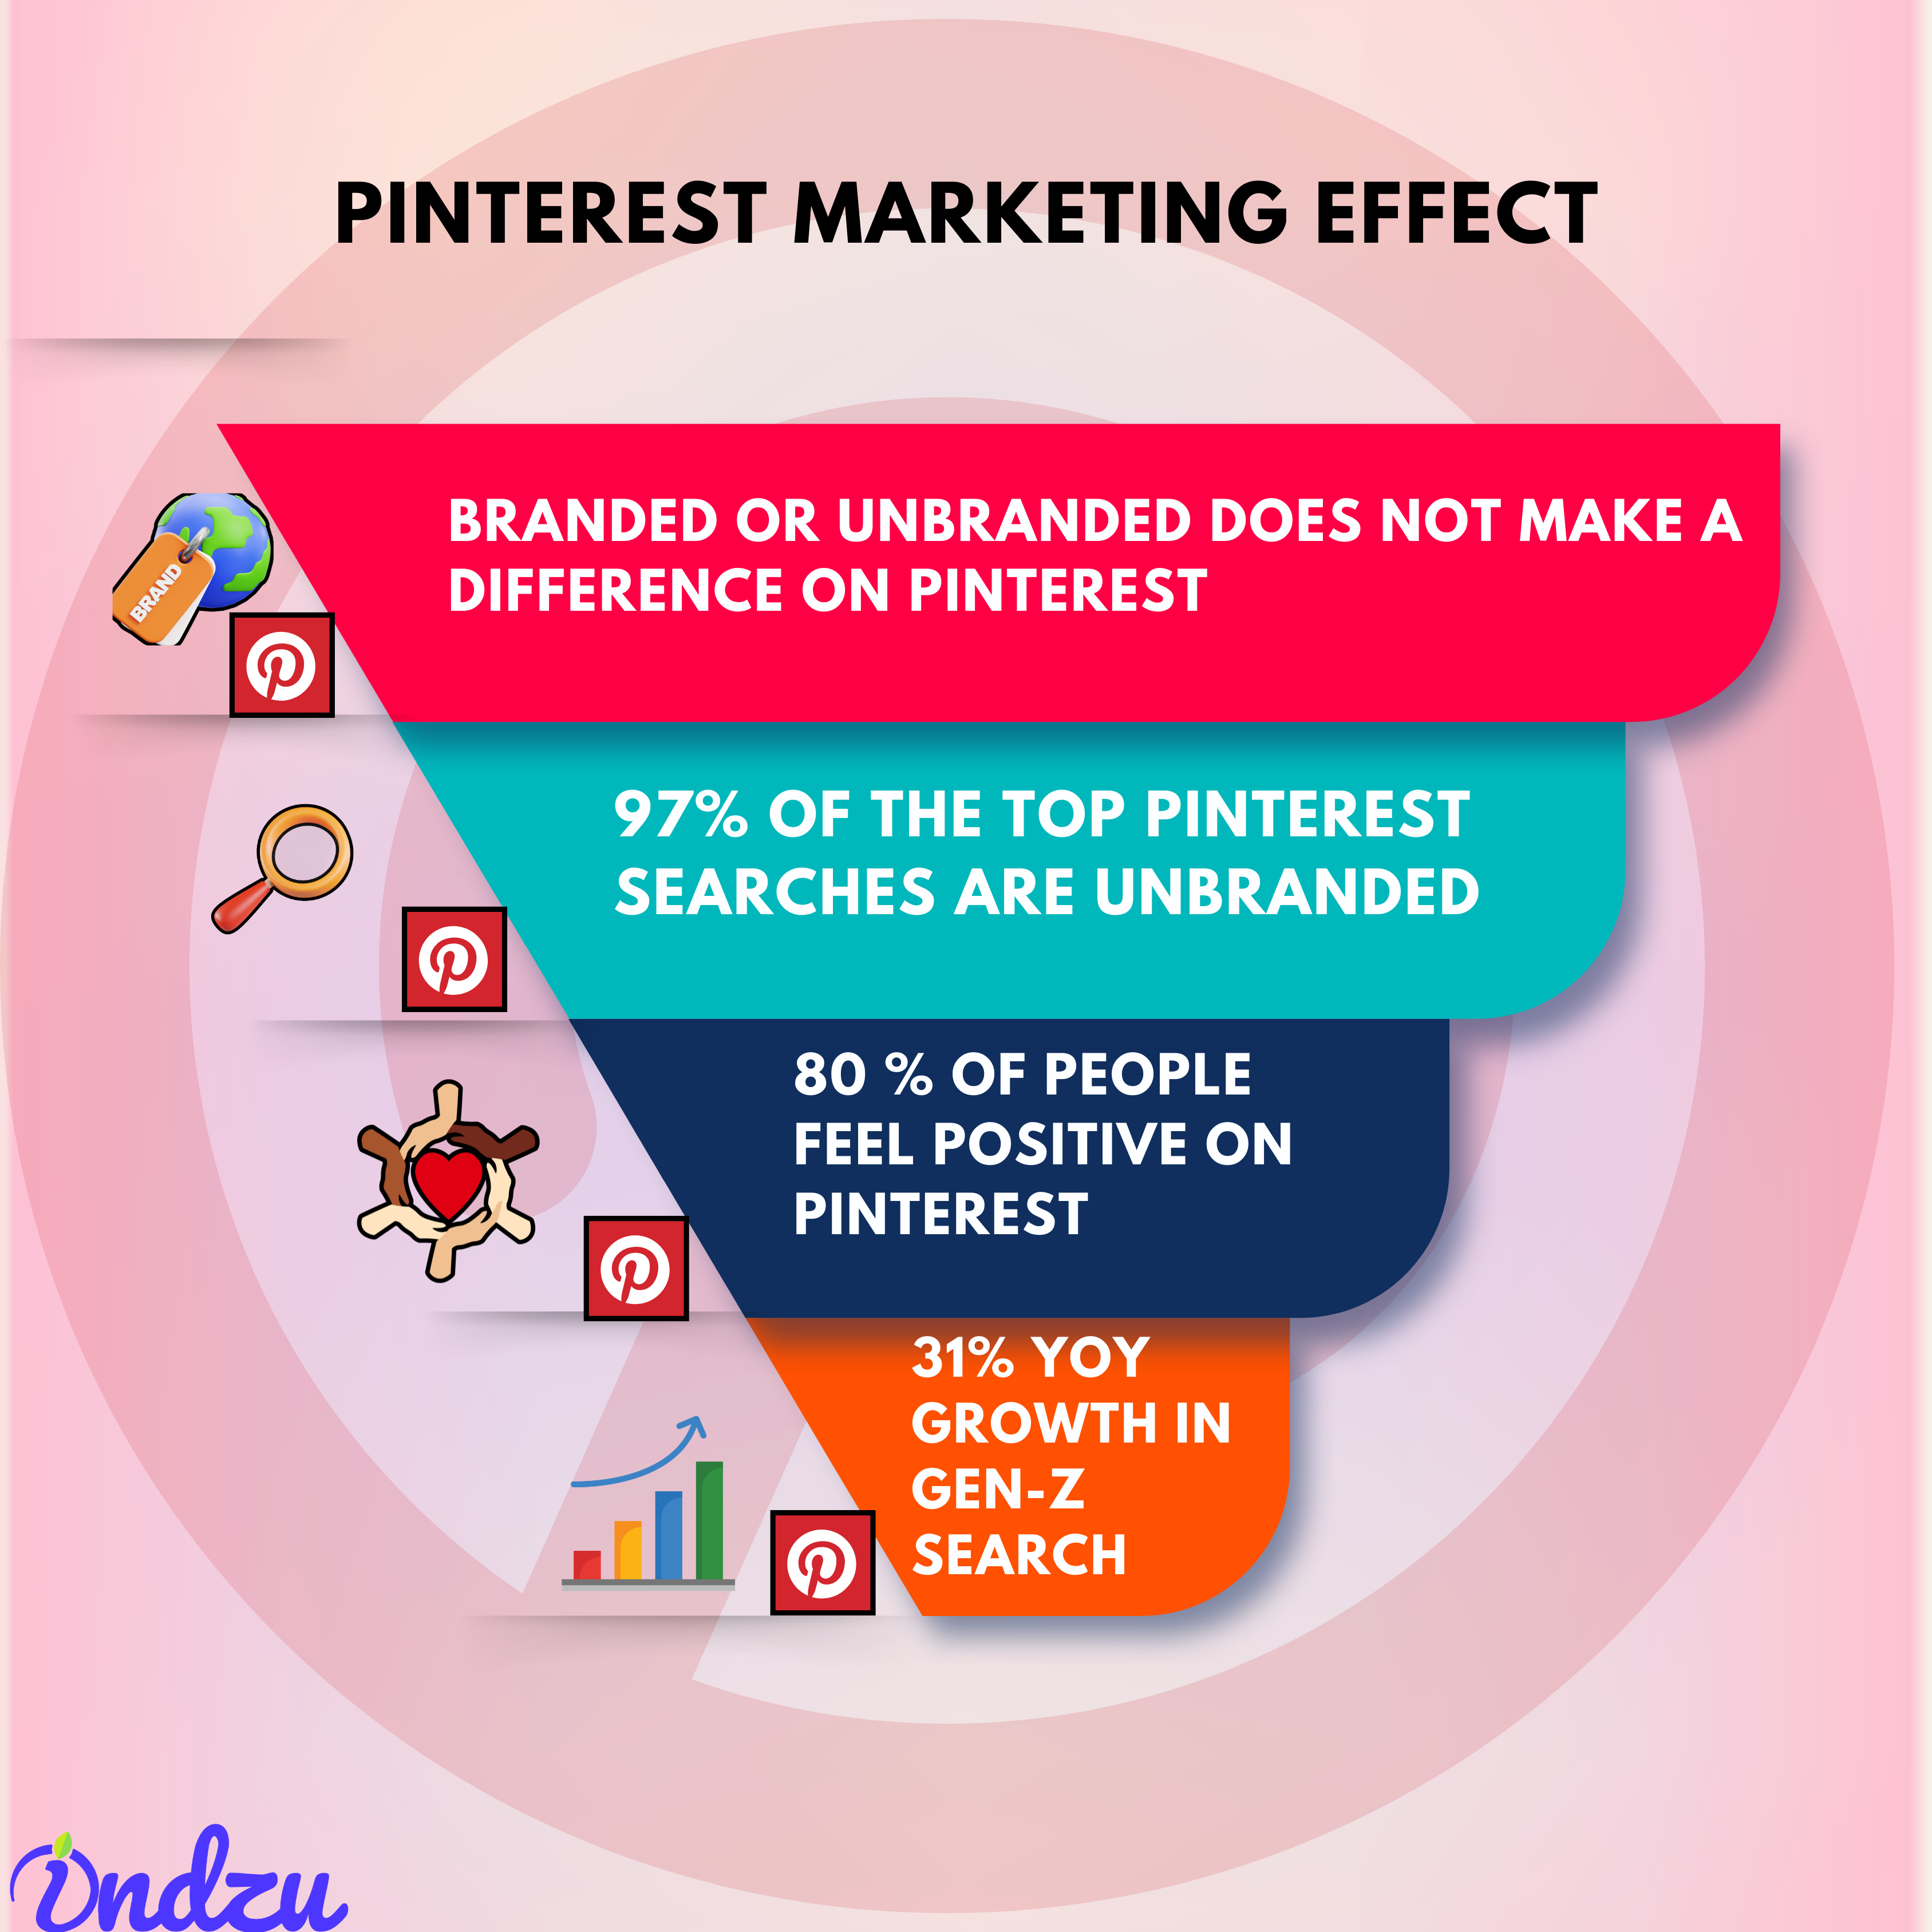
- Branded or Unbranded does not make a difference on Pinterest
- This is why 97% Of The Top Pinterest Searches Are Unbranded (Source-demandsage)
- 80 % of people feel positive on Pinterest
- A Pin including a specific call to action increases engagement
- Here is the table showing Pinterest User Behavior Stats
| Metric | Value |
| Weekly Users Discovering New Brands/Products | 46% |
| Users Feeling Positive About Pinterest | 8 in 10 |
| Likelihood to Click and Visit Brand Website | 3x More Likely |
| Users Considering Pinterest a Go-To for Ideas | 66% |
| Gen-Z Search Growth YoY | 31% |
| Audience Search Growth YoY | 96% |
| Searches Per Pinner Growth YoY | 31% |
- Here is the table showing Pinterest Shopping Behavior Stats
| Metric | Value |
| Users use the platform with the intent to shop and buy, generating direct sales | 55% |
| A Pin having a specific call to action increases engagement by | 80% |
| Users Planning Purchases on Pinterest | 93% |
| Users Shopping Frequently on Pinterest | 75% |
| Premium Product Spending Increase | 87% More |
| Weekly Users Completing Purchases from Pins | 61% |
| Users in a Shopping Mindset | 90% |
| Shopping as a Top Priority | 48% of Users |
| Users want to try something they’ve seen on Pinterest. | 98% |
| Time Spent Shopping on Pinterest | 25%+ |
| Retailer Checkout Increase with Catalog Uploads | 30% |
- Pinterest Trends and Predictions
| Metric | Value |
| Pinterest Trends vs. Other Platforms | 20% Faster Take off |
| Trend Monthly Growth Sustenance | 20% Longer |
| Accuracy of Pinterest Predictions | 8/10 Predictions True |
| Engagement with Trends | Users Revisit Trends Often |
(Source- growthdevil) (Source-analyzify) (Source-thesocialshepherd) (Source-socialpilot)(Source-hootsuite)(Source-adamconnell) (Source-demandsage)
By Advertisements On Pinterest
Pins last longer on Pinterest. As they have longer lifespans on Pinterest.
- Pinterest Ads are 2.3 times cheaper than other platforms.
- 61% of Pinterest users have purchased something after seeing sponsored Pins
Here is a table showing the effectiveness of Pinterest Ads Compared to Other Platforms
| Metric | Pinterest Ads | Comparison/Insights |
| Average Saturation Level | 25% | Lower saturation compared to other platforms ensures a broader audience reach. |
| Return on Ad Spend (ROAS) | 32% better | Especially beneficial for food, health, and beauty businesses. |
| Cost Per Conversion (CPC) Efficiency | 2.3x more efficient | Outperforms other social media platforms. |
| Prospects Generated | 11.4x more | Significantly higher than other platforms. |
| Positive Emotional Reactions | Ads recalled 20% better, 6x higher lift in intent | Emotional ads perform exceptionally well on Pinterest. |
Here is a table showing performance Boosts Based on Ad Features and Messaging
| Ad Feature/Message Type | Effectiveness | Insights |
| Sustainable Messaging | 2.4x more effective in driving action | Sustainable ads resonate strongly with users. |
| Video Ads | 60% of Gen Z users find them most effective | Captures attention effectively, especially for new products. |
| Catalogues and Shopping Ads Combination | 15% increase in ROAS | Integrating both ad types improves performance. |
(Source-demandsage) (Source-socialpilot) (Source-analyzify)
By Number Of Employees
- As of November 2024, Pinterest has approximately 11K employees across 6 continents, including North America, Europe, and Asia. (Source-leadiQ)
Table: Pinterest Workforce Gender Representation (Source-hootsuite)
| Year | Metric | Percentage | Change/Insights |
| 2024 | Workforce Identifying as Female | 55% | 4% increase in female workforce representation. |
| 2023 | Women in Leadership Roles | 36% | 20% increase from the previous period. |
Here is a table showing the number of Full-Time Pinterest Employees (2018-2023)(Source- statista)
| Year | Number of Employees |
| 2018 | 1,797 |
| 2019 | 2,217 |
| 2020 | 2,545 |
| 2021 | 3,225 |
| 2022 | 3,987 |
| 2023 | 4,014 |
By Growth
Slowly and steadily Pinterest is winning all, hearts.
- Pinterest set a record as the quickest site to attract 10 million unique monthly visitors
Here is the table showing Pinterest Ad Revenue Growth
| Year | Ad Revenue | Growth/Forecast |
| 2023 | $3.27 billion | Baseline |
| 2027 (Expected) | $5.1 billion | Significant growth from 2024 |
Here is the table showing Pinterest Usage and Audience Growth
| Metric | Percentage/Value | Insights |
| Year-over-Year (YoY) Usage Growth | 12% | Increase in platform usage. |
| YoY Audience Growth | 23.2% | Strong audience growth. |
| Reachable Advertisers’ Audience | More than 200 million users | Wide reach for advertising campaigns. |
| Expected U.S. User Growth (2024-2027) | +5.1 million users | Represents a 5.25% increase in users. |
| Expected Total U.S. Users by 2027 | 102.2 million users | New peak in user base by 2027. |
Here is the table showing Effectiveness of Pinterest Ads
| Ad Metric | Result/Insights |
| Shopping Ads Conversions | 3x more conversions than other platforms. |
| Incremental Return on Ad Expense | 2x higher than competitors. |
| Lifestyle Photos vs. Stock Product Images | 32% higher click-through rate with lifestyle ads. |
Here is the table showing the Geographic Reach of Pinterest
| Rank | Country | Reach |
| 1 | United States | Highest reach |
| 2 | Brazil | Second-highest reach |
| 3 | Mexico | Third-highest reach |
| Year | Number of Users (in millions) |
| 2019 | 88 |
| 2020 | 90.57 |
| 2021 | 92.64 |
| 2022 | 94.14 |
| 2023 | 95.66 |
| 2024 | 97.13 |
| 2025 | 98.51 |
| 2026 | 99.81 |
| 2027 | 101.04 |
| 2028 | 102.2 |
(Source-thesocialshepherd) (Source-socialpilot) (Source-adamconnell) (Source-analyzify) (Source- growthdevil)
By Pins
- There are over 10 billion Pinterest Boards, and 500 Billion Pins on the platform (Source-Pinterest Newsroom, Pinterest Investor Relations)
- Boards related to home decor, making it the most popular category.
- Most popular trending searches on Pinterest in the US at the time of writing (August 2024) include:
| Summer nails |
| Date night beauty |
| Home bedroom refresh |
| Tattoo ideas |
| Dinner ideas |
The Table Shows Pinterest Content and Engagement Statistics
| Metric | Value |
| Maximum Pins Per User | 200,000 |
| Total Weekly Pins Saved | 1.5 billion |
| Total Boards Created | 4 billion |
| Maximum Boards Per User | 2,000 |
| Total Pins Saved (All-Time) | 240 billion |
| Average Pins Per Active Female User | 158 |
| Related Pins’ Contribution to Engagement | 40% |
This table shows Demographics and Usage Behavior
| User Group | Percentage |
| Users Seeking Accessories, Watches, Jewelry | 70% |
| Users Exploring Food and Drinks | 52% |
| Moms Using Pinterest | 80% |
| Dads with Shared Boards | 3x more likely than average male |
This table shows Pinterest Trends and Celebration Boards
| Metric | Value |
| Celebration-Related Boards (2023) | 14.6 million |
| Growth in interest Trends Increase | 56% |
- (source-socialpilot) (source-adamconnell) (source-hootsuite)
By Traffic
- USA gives the highest traffic to Pinterest
This table shows the percentage of traffic Pinterest gets from different countries
| (Country) | Percentage Of Traffic On Pinterest.com |
| United States | 38.06% |
| Brazil | 8.74% |
| Russian Federation | 4.96% |
| India | 4.96% |
| Colombia | 2.41% |
| Others | 40.87% |
This table provides a clear breakdown of Pinterest’s traffic sources.
Table: Traffic Sources for Pinterest
| Traffic Source | Percentage of Total Traffic |
| Direct Traffic | 58.63% |
| Organic Traffic | 38.48% |
| Referral Traffic | 1.69% |
| Social Media Traffic | 1.00% |
This Table shows the sources of Referred Traffic to Pinterest.com
| Source | Percentage of Referred Traffic |
| Yandex.com | 6.06% |
| Linktree | 3.35% |
| Etsy | 2.8% |
| Tailwind | 1.57% |
- The visit duration of the visitors on Pinterest.com is recorded to be 12 minutes and 23 seconds
This table shows the traffic to Pinterest in the year 2023
| Year | Traffic in Billion |
| August 2023 | 1.06 billion |
| September 2023 | 1.03 billion |
| October 2023 | 1.14 billion |
| November 2023 | 1.12 billion |
| December 2023 | 1.16 billion |
- Gen-Z gives the highest amount of traffic to Pinterest.
This table displays the share of traffic received on Pinterest.com from different age groups:
| Year | Percentage Of Traffic On Pinterest.com |
| 18 to 24 years | 24.78% |
| 25 to 34 years | 27.96% |
| 35 to 44 years | 17.79% |
| 45 to 54 years | 12.88% |
| 55 to 64 years | 10.04% |
| Over 65 years | 6.55%. |
- (Source-demandsage) (Source-adamconnell) (Source-analyzify)
By Rising E-Commerce On Pinterest
- 92% of online retailers with social commerce are present on Pinterest
- Pinterest users purchase more on social commerce than other platforms
This table shows Pinterest’s E-Commerce Performance
| Metric | Value/Insight |
| Year-over-Year Increase in Clicks and Saves for Buyable Content | 50% |
| Average Revenue Per User (ARPU) in Europe (Q2 2024) | $1.03 |
| Purchase Intent Value on Pinterest | $30 |
| Items Bought per User on Pinterest (2023) | 3.5 items |
| Shoppers’ Spend per Order on Pinterest | $30 |
| Return on Ad Spend for Brands Using Pinterest Catalogs | 2x |
| Product Impressions for Brands Using Catalogs | 5x more |
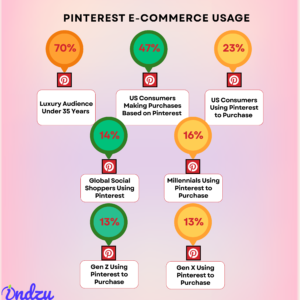
This Table shows Pinterest E-Commerce Demographics and Usage
| Demographic | Percentage/Insight |
| Luxury Audience Under 35 Years Old | 70% |
| US Consumers Making Purchases Based on Pinterest Recommendations | 47% |
| Consumers Using Pinterest to Purchase Products (2023) | 23% (US) |
| Global Social Shoppers Using Pinterest | 14% (both male and female) |
| Millennials Using Pinterest to Purchase | 16% |
| Gen Z Using Pinterest to Purchase | 13% |
| Gen X Using Pinterest to Purchase | 13% |
(Source-demandsage, -analyzify), -whop)
By Future Growth
- Pinterest has shown quick growth among other social media platforms, second only to Instagram.
This table shows Pinterest’s Future: Stats and Initiatives Shaping Its Growth In E-Commerce Innovations and Partnerships
| Initiative | Insight/Action |
| Scaling Shopping Ads | Partnered with Amazon Ads to promote e-commerce. |
| Integration with Salesforce and Adobe Commerce | Available in all monetized markets. |
This Table Shows the Sustainability Commitments Of Pinterest
| Initiative | Goal |
| Renewable Electricity Commitment | 100% renewable electricity for global offices by 2025. |
| Environmental Impact | Aims to reduce greenhouse gas emissions globally. |
This Table Shows The Commitment Of Pinterest Towards The Body-Inclusivity and Healthy Living
| Initiative/Trend | Impact/Insight |
| Focus on Plus-Sized Body Content | Searches for plus-sized body content are increasing. |
| Commitment to Body-Inclusivity (Since 2018) | Platform prioritizes diversity in content. |
| Updated Ad Policies (July 2021) | Ads with weight loss language and imagery are prohibited. |
| Decline in “Weight Loss” Searches | 20% decrease in searches containing “weight loss.” |
(Source-hootsuite,-demandsage)
By Affiliate Marketing
- High-income demographics and strong ARPU in specific regions suggest lucrative opportunities for affiliate marketing.
Table 1: Demographics of High-Income Pinterest Users
| Income Group | Percentage of Pinterest Users | Insights |
| US Households Earning $150k+ | 40% | High-income users actively use Pinterest. |
| Luxury Shoppers Earning $100k+ | ~33% | A significant proportion of luxury shoppers are affluent. |
| Likelihood of Luxury Shoppers Earning 6 Figures (Compared to Other Platforms) | 35% more likely | Pinterest outperforms other platforms in attracting high-income luxury shoppers. |
This table shows the Average Revenue Per User (ARPU) by Region
| Region | ARPU (in USD) | Insights |
| Global Average | $6.44 | Reflects Pinterest’s overall revenue generation per user. |
| US & Canada | $25.52 | Significantly higher than other regions. |
| Europe | $3.73 | Moderate ARPU compared to the global average. |
| Rest of the World | $0.50 | Indicates lower monetization potential in these regions. |
(Source-adamconnell)
The Ifs, Buts, and Pitfalls Of Pinterest
- Pinterest is the hub for ideas, inspiration, affiliate marketing, saving pins, and a lot more, but brands do not prefer Pinterest as an advertisement platform. Many brands are skeptical about advertising on Pinterest.
- Pinterest was making a loss till 2022. It made losses of $96 million in 2022. The net loss had also peaked in 2019, resulting in a $1.36 billion U.S. dollars loss.
- Pinterest has added some AI integrations and tools to improve its Ad platform, but the tools have not given any significant performance. Advertisers running continuous campaigns, most of their spending is more experimental or short-term.
- Pinterest Algorithms are unpredictable and constantly updated, making it difficult for marketers to plan their content and see results.
- The platform has many good-looking pins, and the oversaturation rate is increasing daily. The competition keeps on growing for content creators and marketers, giving less attention to the time and energy they spend on Pinterest
- There is no real-time interaction among the users. Therefore, the pins on the platform feel passive and result in less engagement. Pinterest focuses more on discovery and saving pins; hence, there are limited real-time interactions.
(Source- growthdevil, investopedia, projectmanager)
If We Sum Up
Pinterest has faced some losses in the past, but it is one of the fastest-growing social media and search engine platforms. It is the 15th most popular social media platform. Also, it gives a good chance of discoverability and affiliate marketing. One should not ignore Pinterest at any cost.
If you want to know about other social media platform stats before planning your strategy, check them out here.
Share this article


More To Explore
 Social
How to delete a comment on Instagram?
Did your friend roast you under one of your Instagram posts? That’s what friends do:...
June 25, 2025 Social
How to delete Instagram account?
You want to stay away from Instagram and delete your account. Or you always think...
June 23, 2025 Social
How to clear Instagram cache?
Is your Instagram slowing down, or are you experiencing a glitch? Learn how to clearInstagram...
June 18, 2025 Social
Why can’t I follow people on Instagram?
Everything is just going fine. You gain some new friends on Instagram. This feels so...
June 16, 2025 Social
How to turn off Meta AI on Instagram
Meta AI was launched on Instagram in April 2024. When many people found it amazing...
June 12, 2025 Social
Best Instagram Reel length for Maximum Engagement
Instagram Reels have become a cornerstone of content marketing on the platform. This blog explores...
June 9, 2025 Social
How many Instagram accounts can I have?
Do you want to have another Instagram account? Do you feel it’s necessary to have...
June 3, 2025 Social
Tips for Evaluating Social Media Tools During Free Trials
4.89 billion people are using social media across the globe and nearly every individual is...
June 2, 2025 Social
Does Facebook notify when you screenshot a story?
Wondering does Facebook notify when you screenshot a story? The simple answer is no. Facebook...
June 2, 2025 Social
What is the meaning of Instagram user?
Just yesterday, you saw the real user’s name in the DM section, and now you...
May 31, 2025 Social
Why can’t I add music to my Instagram post?
Music is a game changer in content; music can direct our mood and enter directly...
May 28, 2025 Social
What is Quiet Mode On Instagram?
Is there any way you can be on Instagram but not be there at the...
May 22, 2025 Social
What are Impressions on LinkedIn?
Are you posting on LinkedIn to gain more reach and popularity? While you are posting,...
May 13, 2025 Social
Is LinkedIn Premium worth it?
If you see your friend subscribing to LinkedIn Premium and wonder if you could manage...
May 13, 2025 Social
How to change an Instagram password?
Did your friend find out your Instagram password? Here’s how to change an Instagram password...
May 13, 2025 Social
How to get more followers on Instagram?
Done everything? Have you tried all the hacks? Posted all kinds of content? Improved content...
May 12, 2025 Social
How to see if someone unfollowed you on Instagram?
Just some days before, you saw many followers on Instagram, but now you see that...
May 7, 2025 Social
How to block someone on LinkedIn?
Some people do not understand the value of your time; they will constantly send irrelevant...
May 7, 2025 Social
How to download Instagram videos?
You just saw an Instagram reel using the Insta app, and now you want to...
May 6, 2025 Social
Instagram Video Length: Let Us Debug How long can a video be on Instagram?
You saw others posting long videos on Instagram and thought you could do the same,...
May 2, 2025 Social
How to change your name on Instagram
Want to rebrand your Instagram? Learn how to change your name on Instagram! Instagram is...
May 1, 2025 Social
How do you tag someone on Instagram?
You came across relatable content on Instagram, and you want to tag your bestie, but...
April 30, 2025 Social
How to see who shared your Instagram post.
Did you see your post on someone else story and wonder how to see who...
April 29, 2025 Social
All Social Media Stats Research
Social Media Stats Social media was initially created to improve communication among people and make...
March 25, 2025 Social
21 Interesting Stats you need to know about YouTube
Are you a business, looking to grow on YouTube? Or are you a content creator,...
March 17, 2025 Social
TikTok by the Numbers: Must-Know Stats to Dominate in 2025
Most Important TikTok Stats: TikTok is a social media platform that revolutionized social media platforms....
March 12, 2025 Social
What Does Restricting Someone on Instagram Do?
It is a beautiful day, and you want to spend your energy on positive things....
March 11, 2025 Social
How to see and recover deleted messages on Instagram?
You were doing something, and Instagram messages got deleted mistakenly, or you were just in...
March 11, 2025 Social
How to hide followers on Instagram
A lot of your friends, relatives, or colleagues are likely on Instagram. However, you might...
March 11, 2025 Social
22 interesting stats about LinkedIn
Interesting LinkedIn stats: Are you planning to use LinkedIn for your business? Do you wish...
March 11, 2025 Social
How to Change Background Color on Instagram Story
You may not be able to change your life overnight, but at least you can...
March 11, 2025 Social
Essential Instagram Stats You Need to Know in 2025
Do you think of purchasing something and search for it on Instagram before purchasing? Instagram’s...
March 11, 2025 Social
18 Interesting Google My Business Stats 2025
The journey of Google My Business started in 2004 when Google started listing local businesses....
March 10, 2025 Social
Interesting Facebook Stats- You Can’t Ignore in 2025
No one needs an introduction to Facebook, but many people would be surprised to know...
March 10, 2025 Social
Does instagram notify screenshots when you screenshot a story, post, or direct message?
Have you ever wondered does instagram notify screenshots when you screenshot a story, post, or...
March 9, 2025 Social
Can you see who views your Instagram profile, story, and post?
Getting curious about how can you see who views your Instagram profile, story, and post....
March 8, 2025