Last updated on
Interesting Facebook Stats- You Can’t Ignore in 2025
No one needs an introduction to Facebook, but many people would be surprised to know that even though it feels like it was always there, it is just 20 years old as of 2024. Powerful Facebook Stats to know to grow your business.
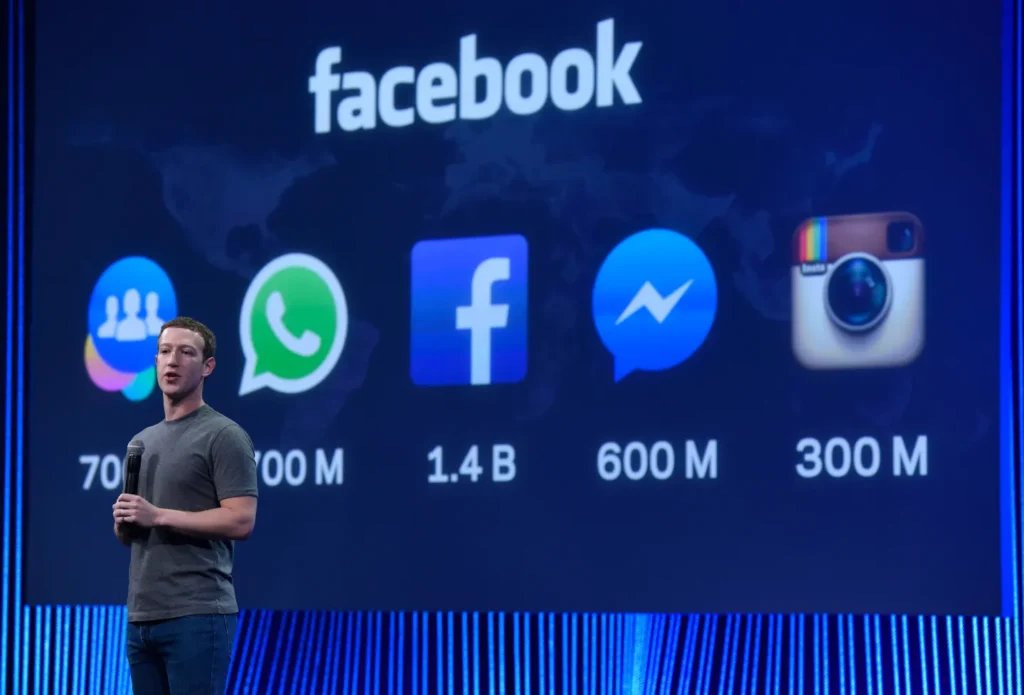
Facebook was created by Mark Zuckerberg in 2004, initially to be used by only his college students. Gradually, its membership expanded to other universities in the United States, and today, It has the third-highest traffic in the world.
How and Why is Facebook So Popular?
People heard of social media in the early 2000s, but in 2004, this term got a boost and was on everyone’s mind.
You can now gather that we are talking about Facebook’s launch in 2004 and how its launch prompted people to use the term “social media” more
-
Large User Base
Fast forward to 2024, Facebook is still the world’s most popular social media platform.
- It is used by 3.05 billion people (monthly) all over the world. This means that 3.05 million out of 8.2 billion people are on Facebook. In other words, almost 38% of the world’s population is on Facebook (monthly).
- As of the last quarter of 2023 the number of daily active Facebook users was 2.1 billion i.e. 25.60 % of the world’s population.
2. Diverse Age Groups
It is a perception that most young people use social media platforms, but that is not entirely true in the case of Facebook, as the demography of Facebook is varied.
As per a report from Statista, approximately,
- 42% of Americans aged 18-34
- 34% of American adults aged 35-54
- 24% of the American adults aged 55 +, liked using Facebook
3. Easier to Use
Facebook has a simple interface and easy-to-understand commands. Most importantly, it has combined your friend circle and entertainment feed.
Its mobile apps like Facebook lite, messenger, and Meta are very smooth and lightweight on devices and get installed or uninstalled easily.
4. Constant Upgrades & Addition
Even though Facebook is the oldest platform in the race, it has surpassed every other platform as it has been constantly upgrading itself and making itself bigger.
- AI & VR integrations
- Purchase of other major platforms like WhatsApp and Instagram
- Facebook Page and Facebook Ads Platforms
Let Us Check The Popularity Of Facebook
By Region
|
Region |
Active Facebook Users (millions) |
|
Southern Asia |
496.3 |
|
Southeastern Asia |
415.2 |
|
Southern America |
261.2 |
|
Northern America |
208.6 |
|
Central America |
121.0 |
|
Western Asia |
111.1 |
|
Northern Africa |
107.1 |
|
Western Europe |
73.2 |
|
Southern Europe |
66.1 |
|
Western Africa |
63.0 |
|
Eastern Europe |
58.4 |
|
Northern Europe |
50.7 |
|
Eastern Asia |
46.4 |
|
Eastern Africa |
29.9 |
|
Southern Africa |
22.2 |
|
Oceania |
18.9 |
|
The Caribbean |
13.5 |
|
Central Asia |
5.8 |
By Time Spent
On average, a person spends 30.9 minutes on Facebook, which is one of the most Time spent on any platform. (Source- eMarketer.)
Maximum Time spent by users aged 55 to 64, i.e., 45 Minutes
| Age Group | Average Time (minutes) |
| 18 to 24 years | 22 |
| 25 to 34 years | 26 |
| 35 to 44 years | 30 |
| 45 to 54 years | 36 |
| 55 to 64 years | 45 |
| Over 65 years | 34 |
By Age
The most significant number of Facebook users are in the 25 to 34-year-old age bracket, which is also supposed to be the most active group in spending money online. (Source – Grab on)
| Age Group | Number of Users (billions) |
| 25 to 34 years | 1.01 |
| 18 to 24 years | 0.727 |
| 35 to 44 years | 0.671 |
| 45 to 54 years | 0.405 |
| 55 to 64 years | 0.263 |
| 65 and older | 0.211 |
By Gender
Males are more active on Facebook than females, contributing to 56.8% of Facebook users. While the female percentage is 43.2%. (Source-demandsage)
| Age Group | Share of Female Users | Share of Male Users |
| 18 to 24 years | 9.5% | 13.5% |
| 25 to 34 years | 12.7% | 18.4% |
| 35 to 44 years | 8.6% | 11.6% |
| 45 to 54 years | 5.5% | 6.5% |
| 55 to 64 years | 3.8% | 3.8% |
| Over 65 years | 3.2% | 2.9% |
By Country
Indian users love Facebook the most, becoming a preferable target for businesses that run ads. As a young country, India loves to spend more online, so many small and medium enterprises run ads for Indian audiences.
(Source – Statista)
| Country | Facebook Audience (in millions) |
| India | 378.05 |
| United States | 193.8 |
| Indonesia | 119.05 |
| Brazil | 112.55 |
| Mexico | 92.7 |
| Philippines | 87.7 |
| Vietnam | 75.3 |
| Bangladesh | 55.6 |
| Thailand | 50.05 |
| Pakistan | 47.35 |
| Egypt | 46.25 |
| Nigeria | 38.65 |
| United Kingdom | 37.45 |
| Colombia | 37 |
| Turkey | 34.25 |
| France | 30.8 |
| Argentina | 28.75 |
| Italy | 27.1 |
| South Africa | 26.7 |
| Algeria | 24.9 |
By reasons of usage
There are many different reasons for which people use Facebook
| Reason | Percentage of People |
| Message friends and family | 72.4% |
| Post or share photos or videos | 63.2% |
| Keep up to date with news and current events | 8.2% |
| Look for funny or entertaining content | 54.7% |
| Follow or research brands and products | 53.0% |
Most users use Facebook to stay connected with their family and friends. The primary method is messaging. (Source- demandsage)
By industry activity
Every industry is active on Facebook as this platform has a massive presence of active users. On average, industries post 4.69 posts / a week. (source – Rival-IQ).
91% of Businesses are present on Facebook (source –whop)
| Industry | Posts per Week |
| Alcohol | 2.6 |
| Fashion | 4.3 |
| Financial Services | 4.7 |
| Food & Beverage | 2.2 |
| Health & Beauty | 3.7 |
| Higher Education | 6.2 |
| Home Decor | 4.0 |
| Influencers | 3.9 |
| Media | 64.6 |
| Nonprofits | 6.0 |
| Retail | 5.1 |
| Sports Teams | 24.3 |
| Tech & Software | 4.4 |
| Travel | 3.1 |
By Growth
The number of Facebook users has always grown and seen an upward trend; even after facing heavy competition from other social media platforms, Facebook has seen growth in each quarter.
Facebook’s monthly active users have risen by 7.18% year-over-year.
(Source -sendshort.ai)
| Year | Active User Accounts (in billions) |
| 2023 | 3.03 |
| 2022 | 2.96 |
| 2021 | 2.91 |
| 2020 | 2.74 |
| 2019 | 2.50 |
| 2018 | 2.32 |
| 2017 | 2.10 |
| 2016 | 1.79 |
| 2015 | 1.59 |
| 2014 | 1.39 |
| 2013 | 1.22 |
| 2012 | 1.06 |
| 2011 | 0.845 |
| 2010 | 0.608 |
By Engagement
Facebook users spend a lot of Time on reels, videos, stories, posts, Facebook groups, and messaging each other daily.
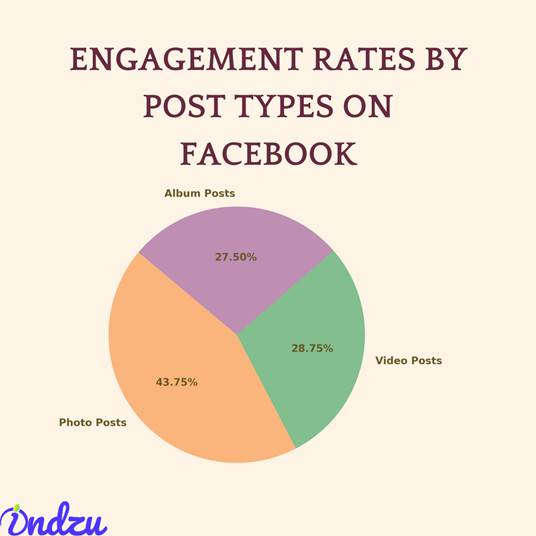
| Post Type | Engagement Rate (%) |
| Photo Posts | 43.75 |
| Video Posts | 28.75 |
| Album Posts | 27.50 |
-
Messages
- Nearly 1 billion people use Facebook Messanger daily (Source-sprout social)
- As of July 2024, Facebook Messanger was downloaded 4 Million times daily (Source-whop)
-
Stories
- 500 Million+ people use Facebook stories every day (Source –Facebook )
- 1 Billion stories are shared every day. (Source-facebook)
-
Reels
- Facebook Reels get 200 billion views per day. ( Source- socialsprout)
- The average interaction number on a reel is 215 per day. (Source- whop)
-
Videos
- Facebook users spend 50% of their Time watching videos on the platform
- More than 2 billion users watch videos on Facebook each month. (Source- whop)
-
Groups
- More than 1.8 Million people join Facebook groups every month.
- On average, 1.75 posts are posted daily on Facebook (as of 2024). (Source- whop)
By Revenue generation
- Facebook primarily generates revenue through its Meta Ads platform, which effectively helps businesses generate leads.
Every year, Facebook has seen a growth in revenue generation. (source-Statista 2024, Meta)
| Year | Revenue (in million USD) |
| 2009 | 777 |
| 2010 | 1,974 |
| 2011 | 3,711 |
| 2012 | 5,089 |
| 2013 | 7,872 |
| 2014 | 12,466 |
| 2015 | 17,928 |
| 2016 | 27,638 |
| 2017 | 40,653 |
| 2018 | 55,838 |
| 2019 | 70,697 |
| 2020 | 85,965 |
| 2021 | 117,929 |
| 2022 | 116,609 |
| 2023 | 134,902 |
| Q1 2024 | 39,070 |
| Q2 2024 | 36,460 |
Facebook’s net income for Q1 2024 was $12.37 billion, which was a remarkable 117% increase from Q1 2023 (Source- Teamgo)
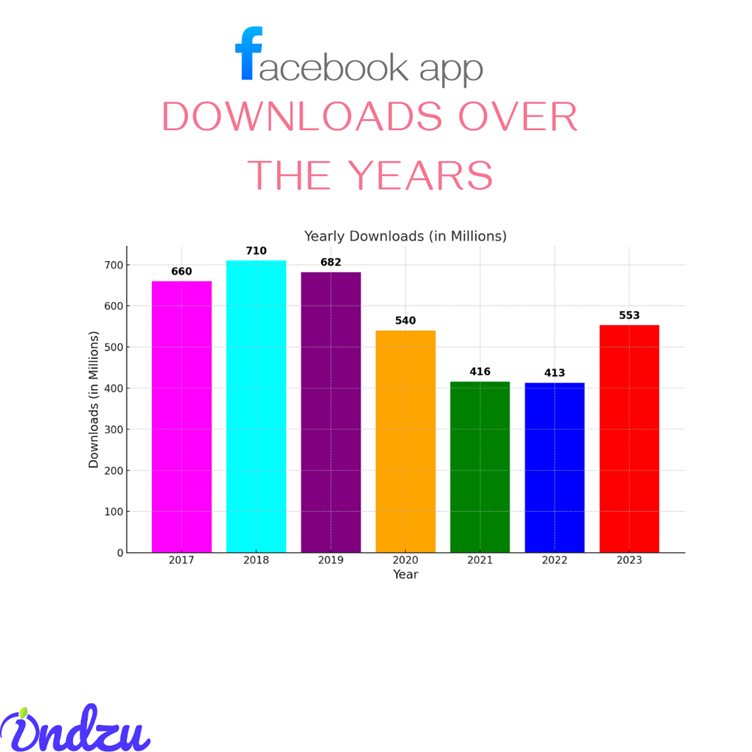
By Facebook App Download
Facebook is one of the most downloaded social media apps on the Google Play Store, with more than 500 million downloads a year.(Source-demandsage)
| Year | Downloads (in millions) |
| 2023 | 553 |
| 2022 | 413 |
| 2021 | 416 |
| 2020 | 540 |
| 2019 | 682 |
| 2018 | 710 |
| 2017 | 660 |
By Business Presence
The number of people using social media has been increasing, and it is predicted that by 2027, there will be 5.85 billion social media users and no business would like to miss the opportunity to make its mark in front of an audience. (Source –synup.com)
- 91% of businesses are already present on Facebook.
- Businesses posted 4.69 times/a week on Facebook.
- According to marketers, Facebook is the second most loved channel for generating ROI. (Source-whop. )
| Platform | ROI (%) |
| 22% |
By Marketing Activities
Facebook is widely used by B2B and B2C companies for their marketing needs.
- But B2B brands liked Facebook the most. (Source- whop)
- 26% of marketers have said that Facebook has some of the best audience targeting features.
- 89% of Social Media Marketers use Facebook for their business promotion.
- If we look at marketers’ leading social media platforms, Facebook will take the lead. (Source– Statista)
By Facebook Ads Published & Reach
Facebook ads were introduced in 2007. Back then, it changed the marketing dynamics. Slowly and slowly, the Facebook ads kept improving themselves by adding many new sophisticated tools and features.
- Currently, there are 8 million active Ad users on META platforms. (Source- wecantrack)
- Mobile ads are dominant, generating around 94% of Facebook’s ad revenue. (Source- electronicshub)
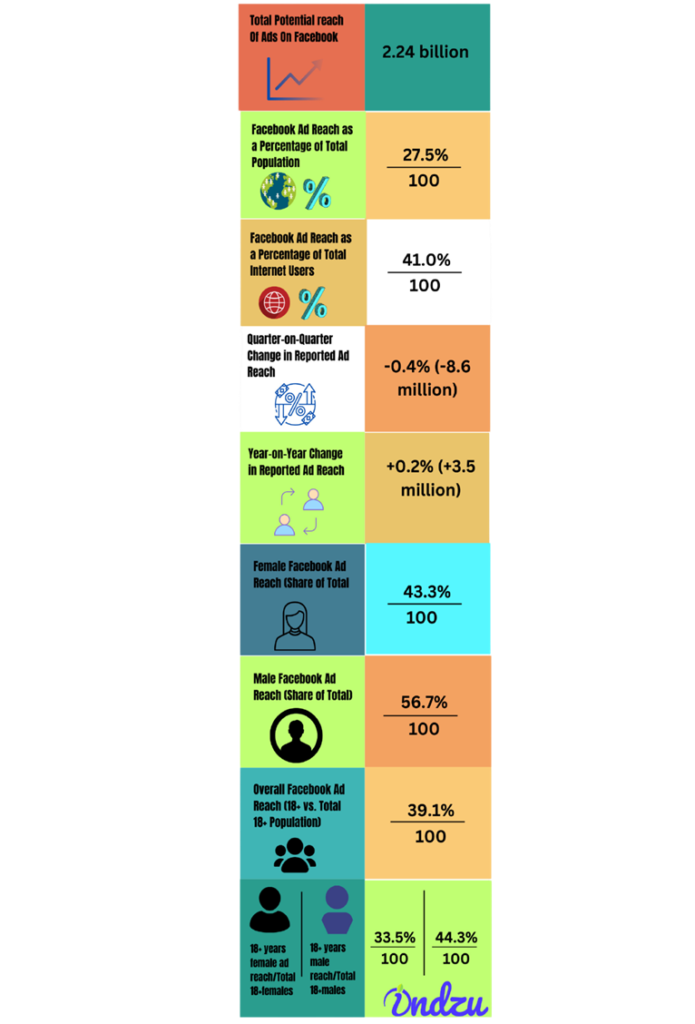
The following table shows the presence of Facebook ads among the audience (source-whop.com)
| Metric | Data |
| Total Potential Reach of Ads on Facebook | 2.24 billion |
| Facebook Ad Reach as a Percentage of Total Population | 27.5% |
| Facebook Ad Reach as a Percentage of Total Internet Users | 41.0% |
| Quarter-on-Quarter Change in Reported Ad Reach | -0.4% (-8.6 million) |
| Year-on-Year Change in Reported Ad Reach | +0.2% (+3.5 million) |
| Female Facebook Ad Reach (Share of Total) | 43.3% |
| Male Facebook Ad Reach (Share of Total) | 56.7% |
| Overall Facebook Ad Reach (18+ vs. Total 18+ Population) | 39.1% |
| Female Ad Reach (18+ vs. Total Female 18+ Population) | 33.5% |
| Male Ad Reach (18+ vs. Total Male 18+ Population) | 44.3% |
By Facebook Ads Engagement
Facebook Ads have improved greatly over the years, resulting in increased Engagement. (Source-whop.in)
- Due to the introduction of AI tools and features, the cost of ads has also been reduced.
Cost Reductions:
| Metric | Reduction Compared to Before |
| Cost per purchase reduction (AI targeting) | 68% lower |
| Cost per conversion reduction | 17% lower |
| Cost per acquisition reduction | 26% lower |
Click-Through Rate (CTR) by Industry (Traffic Campaigns):
| Industry | CTR (%) |
| Arts & Entertainment | 2.55% |
| Real Estate | 2.45% |
| Restaurants & Food | 2.29% |
| All Industries (Average) | 1.51% |
Essential Parameters for Facebook Ads:
| Metric | Value |
| Average CPC (Traffic Campaigns) | $0.83 |
| CTR (Lead Generation Campaigns) | 2.5% |
| Average CPC (Lead Generation Campaigns) | $1.92 |
| Average Cost per Lead (Lead Generation) | $23.10 |
| Average CPM (Ads Targeting Women) | $6.01 |
| Average CPM (Ads Targeting Men) | $4.92 |
- Advertising on Facebook is much cheaper than advertising on Google.
By Facebook Ad reach (country-wise)
As of April 2024, the Facebook ad had an impressive reach of 131.1% in Libya (Source- Statista)
| Country | Facebook Audience Reach (%) |
| Libya | 131.1% |
| U.A.E. | 120.5% |
| Mongolia | 116% |
| Philippines | 114.5% |
| Qatar | 111.7% |
| Cambodia | 109.6% |
| Georgia | 105.8% |
| Vietnam | 102.6% |
| Peru | 101.9% |
| Tonga | 101% |
| Mexico | 100.6% |
| Ecuador | 98.4% |
| Aruba | 96.3% |
| Maldives | 95.4% |
| Cayman Islands | 95% |
| Colombia | 94.7% |
| Bolivia | 94.3% |
| Guyana | 94% |
| Greenland | 92.5% |
| Lebanon | 92.1% |
By Facebook Marketplace Usage
Facebook marketplace is a hub for buying, selling, or swapping goods and services. This is just like Facebook’s online marketplace. It was started in 2016, and today it has 1 billion monthly visitors. (Source –coupert.com, increditools.com)
| Metric | Value |
| Monthly Facebook Marketplace Users | 1.1 billion |
| Monthly Sellers on Facebook Marketplace | 250 million |
| Countries Using Facebook Marketplace | Over 200 |
| Facebook Marketplace Users (Germany, 16-29) | 15% |
| Countries with Over 100M Users | Brazil, India, Indonesia, United States |
| Advertising Audience on Marketplace | 562 million |
| Users Searching for Vehicles | 18.6% of Facebook users |
| Revenue Generated (2024) | $39.071 billion |
| Luxury Shoppers (Second-hand Market in USA) | 53% |
| Average Conversion Rate | 9% |
| Most Popular Item Category | Second-hand branded clothing |
| Home Rentals Listings | 30% of total listings |
| Female Users on Marketplace | 61.8% |
| Exclusive Buyers on Marketplace | 474 million |
| Most Active Age Group (USA) | 25-34 |
| Users Checking Marketplace Monthly | 50% of Facebook users |
| Users from Latin America | 42% of Marketplace users |
| Average Time Spent per Visit | 30.5 minutes |
By Facebook’s employees
Meta, Facebook’s parent company, has always seen an increase in employee numbers. But the previous year has been an exception. (Source- macrotrends, financesonline.)
| Year | Number of Employees |
| 2024 | 72,404 |
| 2023 | 67,317 |
| 2022 | 86,482 |
| 2021 | 71,970 |
| 2020 | 58,604 |
| 2019 | 44,942 |
| 2018 | 35,587 |
| 2017 | 25,105 |
| 2016 | 17,048 |
| 2015 | 12,691 |
| 2014 | 9,199 |
| 2013 | 6,337 |
| 2012 | 4,619 |
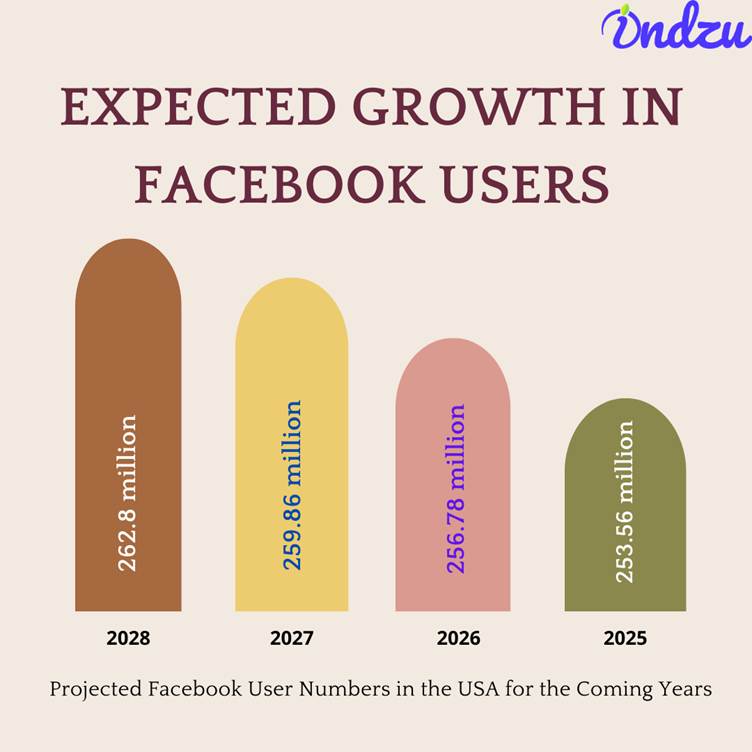
By Future Growth Statistics
As we know, Facebook’s growth has been constant. According to Statista, Facebook’s future predictions can be like this:
| Year | Facebook Users in the USA (in millions) |
| 2028* | 262.8 |
| 2027* | 259.86 |
| 2026* | 256.78 |
| 2025* | 253.56 |
Projected values for future years
Facebook Ad Revenue Prediction( Source-.electronicshub )
| Year | Facebook Ad Revenue Forecast (in Billions USD) |
| 2025 | $187.35 |
| 2026 | $202.94 |
Facebook’s Focus for the next 20 years: (Source- Facebook)
- Building the next generation of social media Specifically designed for young adults.
- Leaning into new product capabilities:
- Powered and enabled by advancements in Artificial Intelligence (AI)
- Improving the video-watching & sharing experience of people as there is an increase in video sharing by 80% year over year.
Some other interesting stats about Facebook
(Source- Teamgo)
- Engagement
Facebook is the 3rd most used app on Mobile Devices, after WhatsApp and YouTube
- About 64.1% of Android app Facebook users spend Time on the app daily
- Facebook is the 3rd most visited website in the USA as of April 2024, getting a traffic of 2.90 billion monthly traffic
- Facebook has a search volume of 584.9 Million.
(Source- Teamgo)
- Usage and Diversity
- 2/3 of the global population visit Facebook at least once a month.
- Facebook’s most active users belong to the Asia Pacific region, with 1.37 billion users.
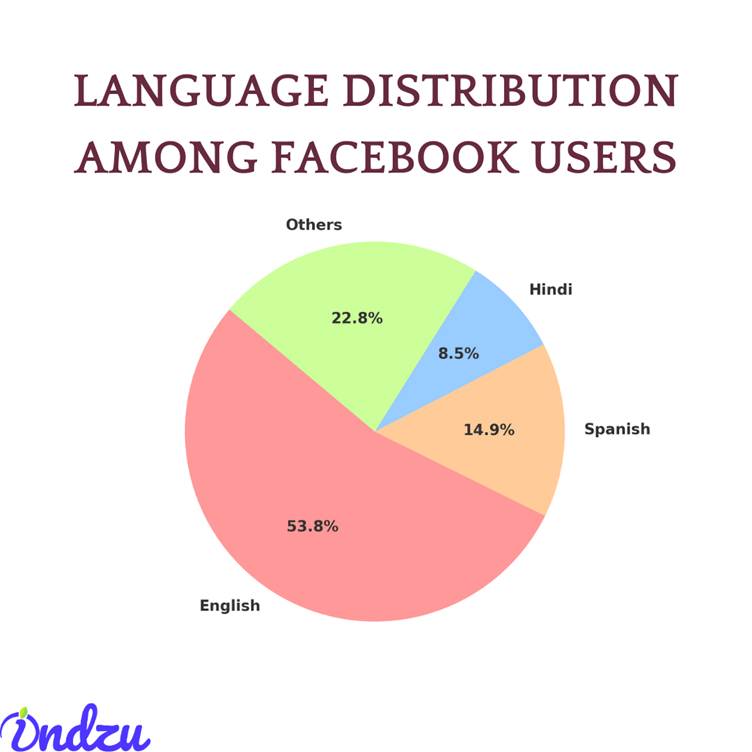
Since Facebook supports 100 languages. Language diversity can be seen among Facebook users. English is the most preferred language on Facebook. (Source- Teamgo)
- 60% of users turn to Facebook to stay on track with News and current events. 30 % of Americans use Facebook as their primary source of News.
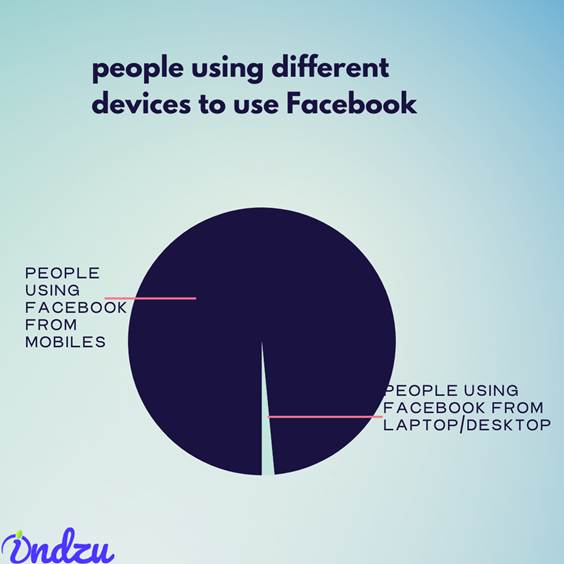
- It can also be seen that more people use Facebook on mobile devices.
- Facebook usage by device: (source- demandsage.com)
| Device | Share of Users (%) |
| Any mobile device | 98.5% |
| Laptop or Desktop | 1.5% |
| Both phones and computers | 16.7% |
| Only via a mobile phone | 81.8% |
The Ifs, Buts, and Pitfalls of Facebook
There is no doubt that Facebook has a massive user base, but there have been several fluctuations in its growth rate.
- Although the number of users on Facebook has kept growing, the growth rate has decreased. ( Sources: backlinko)
| Time Period | Facebook User Growth Rate (DAUs) |
| Q1 2020 to Q1 2021 | 15.3% |
| Q1 2021 to Q1 2022 | 4.4% |
| Q1 2022 to Q1 2023 | 3.9% |
| Q2 2022 to Q2 2023 | 4.9% |
| Q3 2022 to Q3 2023 | 5.1% |
| Q4 2022 to Q4 2023 | 5.5% |
- Not only is there a slowdown in the growth rate of Facebook, but there have been issues with safety and privacy on Facebook
- 62% of users reported scams on Facebook weekly.
(Source-whop.com)
Here’s the data organized into a table:
| Metric | Value |
| Fake accounts (Q2 2024) | 3% of worldwide monthly active users |
| Fake accounts (2023) | 4% of worldwide monthly active users |
| Trademark violation reports (2023) | Over 1.33 million |
| Copyright infringement reports (2023) | Close to 5 million |
| Counterfeit IP reports (2023) | Over 436,000 |
| Percentage of scams on Facebook Marketplace (2023) | 34% of ads |
| Estimated consumer losses from Marketplace scams (2023) | $79 million |
Facebook has taken strict steps to curb fake accounts, scams, and infringements.
If we sum up
There is no doubt that the popularity of Facebook has declined among teens, and many do not prefer it. Instead, platforms like TikTok, Instagram, and Threads have gained more popularity each day.
However, the massive user base of Facebook and features like Marketplace, Targeted Ad marketing, Facebook communities, professional dashboards, etc., have made Facebook one of the most relevant platforms for business promotion and marketing.
Also, Facebook is popularly known for finding mutual friends and connecting with old friends, extended families, and relatives online.
And if you go through the above statistics, you can understand how powerful Facebook has dominated the online world in 20 years.
Do you want to know other social media stats? Check out our other blogs.
Share this article


More To Explore
 Social
How to make an Instagram Story poll?
Want more engagement on your Instagram story in just one tap? You can create Instagram...
July 11, 2025 Social
5 Things You Didn’t Know A Social Media Tool Could Do
91% of entrepreneurs and businesses use social media for marketing to build their brand and...
July 11, 2025 Social
Social listening – What is it and Why it matters in 2025?
If you casually search for some space-saving furniture on a social media platform one fine...
July 9, 2025 Social
Why Most Social Media Management Tools Get Social Media Analytics Wrong – And How to Fix It
Why do most Social Media tools get Social Media Analytics wrong? Simple – they report...
July 8, 2025 Social
How Much Does YouTube Pay for 1 Million Views?
We often see people earning highly from YouTube. YouTubers boast high-end interiors, costly cars, and...
July 3, 2025 Social
How to delete a comment on Instagram?
Did your friend roast you under one of your Instagram posts? That’s what friends do:...
June 25, 2025 Social
How to delete Instagram account?
You want to stay away from Instagram and delete your account. Or you always think...
June 23, 2025 Social
How to clear Instagram cache?
Is your Instagram slowing down, or are you experiencing a glitch? Learn how to clearInstagram...
June 18, 2025 Social
Why can’t I follow people on Instagram?
Everything is just going fine. You gain some new friends on Instagram. This feels so...
June 16, 2025 Social
How to turn off Meta AI on Instagram
Meta AI was launched on Instagram in April 2024. When many people found it amazing...
June 12, 2025 Social
Best Instagram Reel length for Maximum Engagement
Instagram Reels have become a cornerstone of content marketing on the platform. This blog explores...
June 9, 2025 Social
How many Instagram accounts can I have?
Do you want to have another Instagram account? Do you feel it’s necessary to have...
June 3, 2025 Social
Tips for Evaluating Social Media Tools During Free Trials
4.89 billion people are using social media across the globe and nearly every individual is...
June 2, 2025 Social
Does Facebook notify when you screenshot a story?
Wondering does Facebook notify when you screenshot a story? The simple answer is no. Facebook...
June 2, 2025 Social
What is the meaning of Instagram user?
Just yesterday, you saw the real user’s name in the DM section, and now you...
May 31, 2025 Social
Why can’t I add music to my Instagram post?
Music is a game changer in content; music can direct our mood and enter directly...
May 28, 2025 Social
What is Quiet Mode On Instagram?
Is there any way you can be on Instagram but not be there at the...
May 22, 2025 Social
What are Impressions on LinkedIn?
Are you posting on LinkedIn to gain more reach and popularity? While you are posting,...
May 13, 2025 Social
Is LinkedIn Premium worth it?
If you see your friend subscribing to LinkedIn Premium and wonder if you could manage...
May 13, 2025 Social
How to change an Instagram password?
Did your friend find out your Instagram password? Here’s how to change an Instagram password...
May 13, 2025 Social
How to get more followers on Instagram?
Done everything? Have you tried all the hacks? Posted all kinds of content? Improved content...
May 12, 2025 Social
How to see if someone unfollowed you on Instagram?
Just some days before, you saw many followers on Instagram, but now you see that...
May 7, 2025 Social
How to block someone on LinkedIn?
Some people do not understand the value of your time; they will constantly send irrelevant...
May 7, 2025 Social
How to download Instagram videos?
You just saw an Instagram reel using the Insta app, and now you want to...
May 6, 2025 Social
Instagram Video Length: Let Us Debug How long can a video be on Instagram?
You saw others posting long videos on Instagram and thought you could do the same,...
May 2, 2025 Social
How to change your name on Instagram
Want to rebrand your Instagram? Learn how to change your name on Instagram! Instagram is...
May 1, 2025 Social
How do you tag someone on Instagram?
You came across relatable content on Instagram, and you want to tag your bestie, but...
April 30, 2025 Social
How to see who shared your Instagram post.
Did you see your post on someone else story and wonder how to see who...
April 29, 2025 Social
All Social Media Stats Research
Social Media Stats Social media was initially created to improve communication among people and make...
March 25, 2025 Social
21 Interesting Stats you need to know about YouTube
Are you a business, looking to grow on YouTube? Or are you a content creator,...
March 17, 2025 Social
TikTok by the Numbers: Must-Know Stats to Dominate in 2025
Most Important TikTok Stats: TikTok is a social media platform that revolutionized social media platforms....
March 12, 2025 Social
19 Most Important Pinterest Statistics
Many users think that Pinterest is a search engine or the hub for new ideas...
March 12, 2025 Social
What Does Restricting Someone on Instagram Do?
It is a beautiful day, and you want to spend your energy on positive things....
March 11, 2025 Social
How to see and recover deleted messages on Instagram?
You were doing something, and Instagram messages got deleted mistakenly, or you were just in...
March 11, 2025 Social
How to hide followers on Instagram
A lot of your friends, relatives, or colleagues are likely on Instagram. However, you might...
March 11, 2025 Social
22 interesting stats about LinkedIn
Interesting LinkedIn stats: Are you planning to use LinkedIn for your business? Do you wish...
March 11, 2025 Social
How to Change Background Color on Instagram Story
You may not be able to change your life overnight, but at least you can...
March 11, 2025 Social
Essential Instagram Stats You Need to Know in 2025
Do you think of purchasing something and search for it on Instagram before purchasing? Instagram’s...
March 11, 2025 Social
18 Interesting Google My Business Stats 2025
The journey of Google My Business started in 2004 when Google started listing local businesses....
March 10, 2025 Social
Does instagram notify screenshots when you screenshot a story, post, or direct message?
Have you ever wondered does instagram notify screenshots when you screenshot a story, post, or...
March 9, 2025 Social
Can you see who views your Instagram profile, story, and post?
Getting curious about how can you see who views your Instagram profile, story, and post....
March 8, 2025