
Are you a business, looking to grow on YouTube? Or are you a content creator, looking to expand yourself on YouTube? Or maybe you are just curious to know how big YouTube is?
In this blog, we will cover 19 interesting YouTube stats (data-backed), which will give you an idea of how large the YouTube base is and plan accordingly.
YouTube’s key products include:
- YouTube Kids
- YouTube Music
- YouTube Premium
- YouTube Shorts
- YouTube TV
Let us understand YouTube by
Spending 6 hours writing posts that get zero traction?
Paste your URL. ZuAI turns it into 30 brand-on captions in 10 minutes — no blank-page panic, no generic AI filler.
By History
- The founders were frustrated that there was no online platform where people could share their videos, so they decided to create one.
This Table Shows YouTube’s Founding & Early Growth (2005-2006)
| Date | Event |
| February 14, 2005 | YouTube is founded by Chad Hurley, Steve Chen, and Jawed Karim. |
| May 2005 | Beta version of YouTube is launched. |
| April 23, 2005 | The first video, Me at the Zoo, is uploaded by Jawed Karim. |
| August 2005 | YouTube introduces a 5-star rating system and Groups feature. |
| December 2005 | YouTube experiences rapid growth, with thousands of videos uploaded daily. |
| February 2006 | YouTube’s first logo is registered as a trademark, and the domain name is purchased. |
| March 2006 | A 10-minute upload limit is introduced for all videos. |
| April 2006 | YouTube adds the “Directors” feature for content creators. |
| May 2006 | Video responses and cellphone video uploads are introduced. |
| October 2006 | Google acquires YouTube for $1.65 billion, with only 65 employees at the time. |
| November 2006 | YouTube integrates with Google, improving search and monetization. |
This Table Shows Monetization & Global Expansion (2007-2009)
| Date | Event |
| May 2007 | YouTube Partner Program (YPP) launches, allowing creators to monetize videos with ads. |
| June 2007 | YouTube starts supporting multiple languages. |
| August 2007 | YouTube introduces ads for the first time (semi-transparent banners on videos). |
| December 2008 | YouTube HD (High-Definition) support is introduced. |
| December 2008 | Audioswap is launched, allowing creators to use licensed music. |
| April 2009 | Content ID system is introduced to manage copyright claims. |
| November 2009 | 1080p video support is launched. |
| December 2009 | Automatic speech recognition is introduced. |
This Table Shows High-Resolution Videos & YouTube Features (2010-2012)
| Date | Event |
| January 2010 | YouTube launches feature film rentals. |
| March 2010 | The “Thumbs Up/Down” rating system replaces the 5-star rating system. |
| July 2010 | 4K resolution support is introduced. |
| April 2011 | YouTube Live is launched. |
| November 2011 | YouTube Analytics is introduced, offering insights into video performance. |
| June 2012 | YouTube merges with Google Video. |
| July 2012 | The Olympics are live-streamed on YouTube for the first time. |
| October 2012 | YouTube partners with ABC to live-stream a U.S. presidential debate. |
| December 2012 | Gangnam Style becomes the first video to reach 1 billion views. |
YouTube’s Growth & Paid Services (2013-2015)
| Date | Event |
| March 2013 | YouTube reaches 1 billion unique monthly visitors. |
| May 2013 | YouTube introduces paid subscriptions for channels offering premium content. |
| February 2015 | YouTube Kids is launched as a child-friendly version. |
| June 2015 | YouTube Gaming is launched for gaming content. |
| October 2015 | YouTube Red (later YouTube Premium) launches, offering ad-free videos, background play, and exclusive content. |
This Table Shows YouTube’s Key Products & Services
| Product | Description |
| YouTube Kids | Launched in 2015, providing a child-friendly version of YouTube. |
| YouTube Music | A dedicated platform for music videos and streaming. |
| YouTube Premium | A paid subscription for ad-free content, background play, and exclusive content. |
| YouTube Shorts | A short-form video format competing with TikTok. |
| YouTube TV | A live TV streaming service. |
(source- animasmarketing, interestingengineering)
Get 30 days of social content from your website — in 10 minutes.
By Countries Using YouTube
- YouTube is present in 100 countries and 80 languages are available
This table shows the Ranking of YouTube Users by Country (2024)
| Rank | Country | Number of Users (in millions) |
| 1 | India | 637.1 |
| 2 | USA | 238 |
| 2 | Russia | 95.38 |
| 3 | Ukraine | 25.51 |
| 4 | Australia | 15.4 |
| 5 | Chile | 13.91 |
| 6 | Kazakhstan | 11.51 |
| 7 | Belgium | 8.39 |
| 8 | Czechia | 6.45 |
| 9 | Israel | 6.42 |
| 10 | Greece | 6.36 |
| 11 | Portugal | 6.28 |
| 12 | Hungary | 6.1 |
| 13 | Switzerland | 5.92 |
(Source- Statista)
10,000+ brands grew faster with one tool.
By Regions
Here is the table of YouTube Users by Region (2024)(highest & lowest)
YouTube Users by Region (2024)
| Rank | Region | Number of Users (in millions) |
| 1 | Southern Asia | 580.1 |
| 2 | Southeastern Asia | 332.6 |
| 3 | Northern America | 279.1 |
| 4 | Caribbean | 9.6 |
| 5 | Eastern Africa | 9.4 |
As of July 2024, approximately 94.1% of the UAE population used YouTube,( making it the country with the world’s highest YouTube penetration rate.)
(Source- globalmedianinsight) (Source- datareportal.com)
See what ZuAI generates from your website — right now.
Paste your URL. Watch ZuAI write a month of brand-on captions in seconds. Preview before you create an account.
By Number Of Users
- YouTube is the 2nd largest search engine (after Google)
- 2.70 Billion people use YouTube every month
- 122 million+ people access YouTube daily on its mobile app and website
This Table Shows the Percentage of the Global Population Using YouTube
| Statistic | Value |
| Global monthly access | Over a third of the world’s population |
| Percentage of global internet users using YouTube | 47% |
| USA Audience Size | 240 Million(approx.) |
| YouTube’s share of global mobile traffic | 25% |
This table shows YouTube Video Content and Engagement
| Statistic | Value |
| Hours of new videos are uploaded daily | 720,000 hours |
| Total videos watched per day | 5 billion+ videos |
| Average video length | 12m 26s |
| Local versions of YouTube | 100+ |
| Languages available | 80+ |
| Average YouTube visitor page views per day | 9 pages |
This Table Shows YouTube Premium & Music Subscribers
| Statistic | Value |
| Total YouTube Premium & Music subscribers | 80 million+ |
| U.S. YouTube Premium & Music subscribers | 27 million+ |
| Countries/regions with YouTube Premium & Music | 100+ |
This Table Shows YouTube TV Subscribers
| Statistic | Value |
| YouTube TV subscribers in the U.S. | 7.9 million |
| Most subscribed vMVPD service in the U.S. | Yes |
Most Subscribed vMVPD Services in the U.S
| vMVPD Service | Number of Subscribers |
| YouTube TV | 7.9 million |
| Hulu + Live TV | 4.4 million |
| Sling TV | 2 million |
| Fubo | 1.5 million |
(source-webfx) (source-demandsage, backlinko)
One coffee from URL to a full month of scheduled posts.
Drop your URL, brew your coffee, come back to 30 brand-on captions ready to publish.
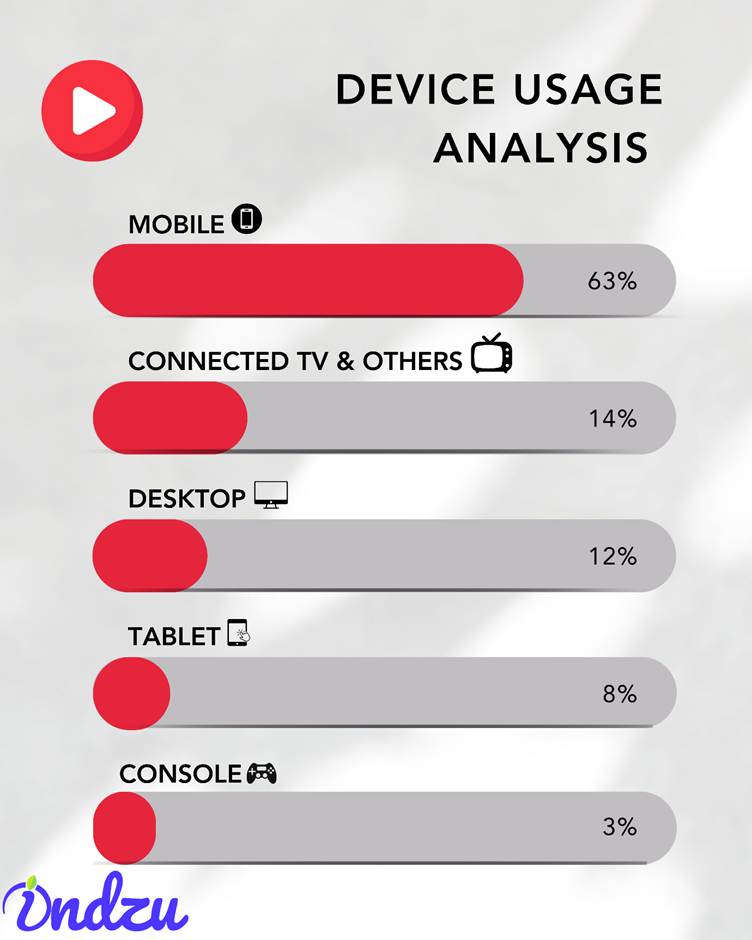
By Device Usage
90% of YouTube visits from users worldwide were from mobile and smart devices (source-webfx)
Here is the table showing the device share for YouTube Video views
| Device | Share of YouTube video views |
| Mobile | 63% |
| Connected TV/other | 14% |
| Desktop | 12% |
| Tablet | 8% |
| Console | 3% |
(source-demandsage, backlinko)
Blank tab. Six open browsers. No clue what to post.


Paste one URL. Get 30 scheduled posts.
By Time Spent
Here is the table showing the time spent on YouTube by an average person
| Statistic | Value |
| Average YouTube visitor page views per day | 9 pages |
| Average daily time spent on YouTube | 19 minutes |
| Average mobile viewing session | 40+ minutes |
| Daily average time U.S. adults spend on YouTube | 48 minutes |
(Source-globalmedianinsight)
Spending 6 hours writing posts that get zero traction?
Paste your URL. ZuAI turns it into 30 brand-on captions in 10 minutes — no blank-page panic, no generic AI filler.
By Age & Gender
YouTube is very special as it is popular across all gender and ages
This table shows the YouTube Gender Distribution (USA & Global)
| Region | Female Users (%) | Male Users (%) |
| USA | 51.4% | 48.6% |
| Global | 45.6% | 54.4% |
Here is a table showing the Distribution of YouTube Users Worldwide (July 2024) by Age and Gender
| Age Group | Female Users (%) | Male Users (%) |
| 18-24 | 6.7% | 9% |
| 25-34 | 9.4% | 12.1% |
| 35-44 | 8.1% | 9.8% |
| 45-54 | 6% | 6.9% |
| 55-64 | 4.6% | 4.8% |
| 65+ | 4.5% | 5% |
- The age bracket of 25-34 is the highest number of users on YouTube.
- In the USA, A large part of the adult population uses YouTube.
- YouTube is the most famous social media platform. 77.7 % of the adult population (18+) uses YouTube.
Here is the table showing YouTube Users by Generation (USA)
| Generation | Share of US YouTube Users (%) |
| Gen Z (1997-2012) | 25.1% |
| Millennials (1981-1996) | 25.5% |
| Gen X (1965-1980) | 19.9% |
| Baby Boomers (1946-1964) | 15.0% |
| Other | 14.5% |
(Source-demandsage, backlinko) (Source-globalmedianinsight)(Source-Statista)
Get 30 days of social content from your website — in 10 minutes.
By Usage
YouTube is not only used for entertainment purposes but also for information purposes.
Here is the table for YouTube Usage Reasons
| Statistic | Value |
| Top 100 searches related to music | 20% |
| Most popular languages on YouTube | English & Spanish |
| YouTube as primary podcast destination (US) | 31% (Spotify: 21%, Apple Podcasts: 12%) |
| Teachers incorporating YouTube into lessons | 86% |
| People using YouTube for entertainment | 82% |
| People using YouTube to follow brands/companies | 18% |
| People using YouTube for professional work | 7% |
| Viewers (30-49) using YouTube as a news source | 37% |
Here is a table showing more in-depth analysis of YouTube Usage by Generational Group with Reasons
| Generation | Age Range | Primary Usage Reasons |
| Gen Z | 12-27 | Humor / Music Discovery / Content Creators |
| Millennials | 28-44 | News / Product Reviews / Entertainment |
| Gen X | 45-59 | Nostalgic Content / DIY Videos |
| Baby Boomers | 60-57 | Product Understanding / How-to Videos / Entertainment |
(Source-analyzify) (Source-wyzowl)
10,000+ brands grew faster with one tool.
By Businesses Using YouTube
- 91% of companies use video marketing. YouTube is the best platform for video marketing.
- 83% of businesses with a YouTube channel have reported that it has helped them gain a local following. (Source-analyzify)
- 70% of Viewers Have Made a Purchase After Seeing a Brand on YouTube (Source-socialshephard)
- 78% Of businesses agree that YouTube is Vial for business growth
- Here is the table showing Top Companies Investing in YouTube Advertising (2023)
(Advertising Spending in Million U.S. Dollars)
| Company | Advertising Spending (Million USD) |
| Apple Inc | 237.15 |
| Disney | 177.76 |
| Donald J. Trump for President | 146.29 |
| Biden for President | 115.76 |
| Riot Games Inc | 103.08 |
| Hulu | 99.14 |
| Procter & Gamble | 95.65 |
| Geico | 91.93 |
| Verizon | 80.54 |
| Expedia Inc | 77.58 |
See what ZuAI generates from your website — right now.
Paste your URL. Watch ZuAI write a month of brand-on captions in seconds. Preview before you create an account.
By Business And Marketing
In the era of content marketing, video marketing is the most popular format. A lot of leads and conversions have been generated via YouTube
YouTube ranked second as a platform where consumers came to spend money after seeing something. (Between March and May 2024)
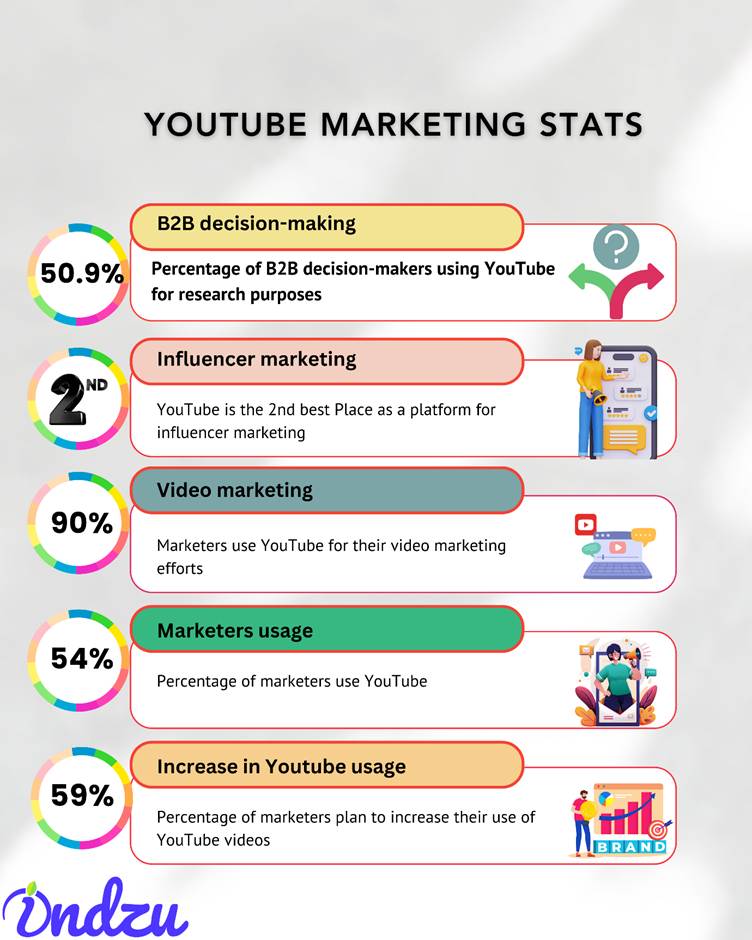
This table shows YouTube Marketing Stats – Usage
| Statistic | Percentage/Rank |
| Percentage of B2B decision-makers using YouTube for research purposes | 50.9% |
| YouTube as a platform for influencer marketing | 2nd best Place |
| Percentage of marketers use YouTube for their video marketing efforts | 90% |
| Percentage of marketers use YouTube (as of 2023) | 54% |
| Percentage of marketers plan to increase their use of YouTube videos (as of 2023) | 59% |
This table shows YouTube Marketing Stats – Trust & Engagement
| Statistic | Percentage/Year |
| Percentage of YouTube users consider it a trustworthy platform | 70% |
| Percentage of Viewers Have Made a Purchase After Seeing a Brand on YouTube | 70% |
| Percentage of YouTube users felt YouTube was more relatable | 39% |
| Percentage of Gen Z said YouTube was more relatable | 56% |
| Percentage of viewers said YouTube was more influential than traditional TV, streaming, or movies (as of 2024) | 33% |
| Percentage of Gen Z said YouTube was more influential than traditional TV, streaming, or movies (as of 2024) | 47% |
YouTube Marketing Stats – Ads & Marketing Performance
| Statistic | Percentage/Year |
| Ads Targeted by Intent Have | 100% Higher Lift in Purchase Intent |
| Pre-roll skippable ads are preferred by | 29% of respondents |
| A percentage of respondents felt non-skippable ads were effective | 7% |
| YouTube’s global advertising revenue increased by a percentage ( compared to 2022) | 8% |
| Percentage of marketers saw improvement in ROI due to anti-ad blocker measures | 38% |
| Percentage of marketers saw a noticeable improvement in performance due to anti-ad blocker measures | 45% |
YouTube Marketing Stats – Video Performance
| Statistic | Percentage/Year |
| Ideal Length for a YouTube Video | 7-15 min |
| Viewers selected YouTube video content (as of 2024) | Most Engaging |
| Percentage of users ranked short videos under 5 minutes as the most engaging | 45% Of Users |
| Users said long videos were more engaging | 21% Of Users |
| Users said live streams were the most engaging | 11% Of Users |
One coffee from URL to a full month of scheduled posts.
Drop your URL, brew your coffee, come back to 30 brand-on captions ready to publish.
By Advertisements On YouTube
As YouTube usage and popularity are huge, every business runs Ads on this platform to gain maximum reach.
Between 2010 to 2023, YouTube’s Ad revenue increased by 3,838% from $0.8 billion to $31.5 billion.
This table shows YouTube Advertising Revenue & Growth
| Statistic | Value | Year |
| YouTube’s Ad revenue in 2023 | $31 billion | 2023 |
| YouTube’s ads accounted for a 10.09% share of Alphabet’s overall revenue in the (first nine months of 2023) | 10.09% | 2023 |
| Biggest revenue jump during pandemic (2020-2021) | $9.1B (46% increase) | 2020-2021 |
Blank tab. Six open browsers. No clue what to post.
Paste one URL. Get 30 scheduled posts.
YouTube Ad Reach & Demography
This table shows YouTube Ad Reach & Demographics
| Statistic | Value |
| YouTube’s total potential ad reach(as of 2024) | 2.5 billion |
| YouTube’s ad reach among users aged 18+(as of 2024) | 2.17 billion |
| YouTube’s total ad reach vs world population(as of 2024) | 31% |
| YouTube’s total ad reach vs total Internet users(as of 2024) | 46% |
| YouTube’s advertising reach (male internet users)(as of 2024) | 54% |
| YouTube’s advertising reach (female internet users)(as of 2024) | 46% |
| YouTube accounted for 10% of social media-driven web traffic (3rd place)(as of 2024) | 10% |
This Table Shows YouTube Ad Reach by Country (2024)
| Country | Ad Reach vs Population (%) |
|---|---|
| Bahrain | 102% |
| Lebanon | 100% |
| Oman | 99% |
| Qatar | 96% |
- The USA has always been a good market for targeting via YouTube ads.
- The US has generated the most ad revenue for YouTube. The country’s contribution to YouTube’s total ad revenue has remained within the 45%-50% range.
This Table Shows The YouTube Ad Revenue Contribution by Region (2020-2023)
| Year | US Contribution (%) | EMEA(Europe, the Middle East and Africa Contribution)(%) |
| 2020 | 47% | 30% |
| 2021 | 46% | 31% |
| 2022 | 48% | 29% |
| 2023 | 47% | 30% |
Spending 6 hours writing posts that get zero traction?
Paste your URL. ZuAI turns it into 30 brand-on captions in 10 minutes — no blank-page panic, no generic AI filler.
YouTube Ads Market Trends
This table shows YouTube Ads Market Trends & Budget Allocation by marketers
| Statistic | Value |
| Marketers using paid ads on YouTube (as of 2024) | 52% |
| Marketers without a YouTube budget (as of 2024) | 32% |
| Marketers allocating over 51% of the budget to YouTube (as of 2024) | 21% |
| Marketers planning to increase YouTube marketing budget (as of 2024) | 65% |
| Marketers planning to maintain their budget (as of 2024) | 18% |
| Marketers uncertain about budget allocation (as of 2024) | 7% |
| Marketers planning to decrease investment (as of 2024) | 10% |
This Table Shows YouTube RPM and CPM Rates by Category
| Category | Estimated RPM ($) | Estimated CPM ($) |
| Low Shorts RPM | 0.01 | 0.02 |
| Typical Shorts RPM | 0.05 | 0.09 |
| High Shorts RPM | 0.08 | 0.15 |
| Music | 0.75 | 1.36 |
| Entertainment / Pets & Animals | 1.00 | 1.82 |
| Gaming | 2.50 | 4.55 |
| People & Blogs / How To & Style | 3.50 | 6.36 |
| Education | 5.00 | 9.09 |
| Digital Marketing / Finance (Lower Bound) | 8.00 | 14.55 |
| Digital Marketing / Finance (Upper Bound) | 20.00 | 36.36 |
This Table Shows YouTube Ad Performance & Relevance
| Statistic | Value |
| A percentage of YouTube users said that YouTube ads were more relevant than ads on linear TV or other streaming apps(as of 2024) | 59% |
| YouTube accounted for the percentage of social media-driven web traffic in 2024 (3rd place)(as of 2024) | 10% |
| In-app purchases in January 2024 (US)(as of 2024) | $29M |
| In-app purchases in January 2024 (Japan)(as of 2024) | $19M |
| Percentage Of Businesses Happy With ROI They Get From YouTube Ads | 75% |
| Percentage Of Small Businesses Benefited By YouTube Marketing | 83% |
| YouTube’s global in-app revenue (as of 2021) | $1.2B |
| US contribution to YouTube’s in-app revenue (as of 2021) | $567M |
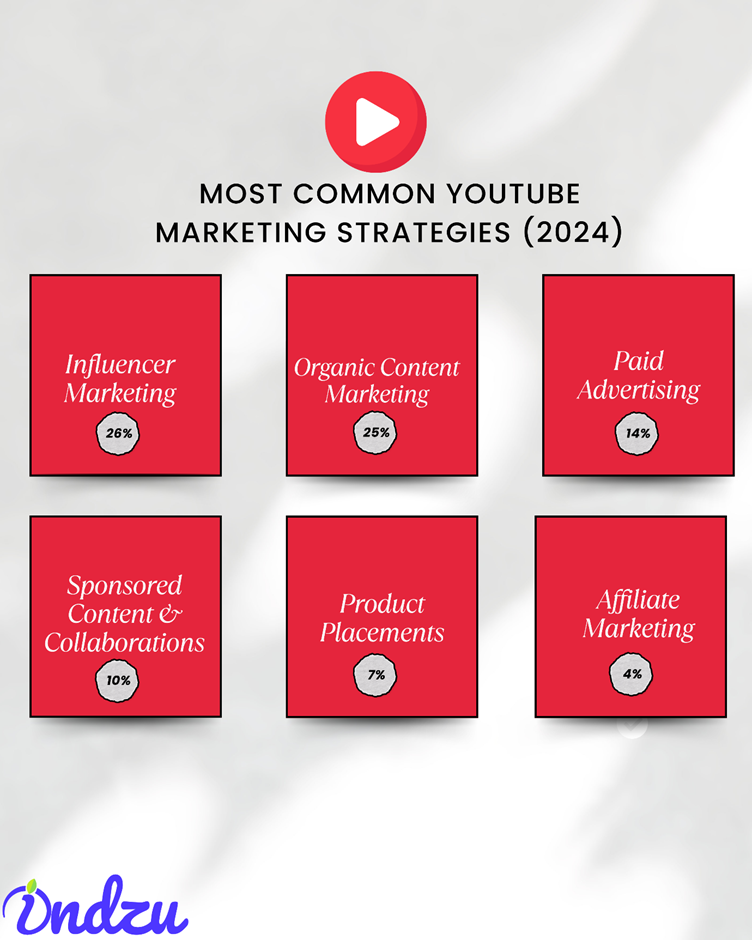
The Table Shows Most Common YouTube Marketing Strategies (2024)
| Marketing Strategy | Usage Percentage (%) |
| Influencer Marketing | 26% |
| Organic Content Marketing | 25% |
| Paid Advertising | 14% |
| Sponsored Content & Collaborations | 10% |
| Product Placements | 7% |
| Affiliate Marketing | 4% |
(Source-analyzify)(Source-globalmedianinsight)(Source-demandsage, backlinko)(Source-webfx)(Source-whop)(Source-socialshephard)
Get 30 days of social content from your website — in 10 minutes.
By E-Commerce Marketing
Shopping and video marketing have now become inseparable.
A lot of businesses use YouTube for marketing their products and also get good ROI.
This table shows YouTube’s Influence on Consumer Purchase Decisions
| Statistic | Percentage/Value |
| YouTube users who watched YouTube to help them make a purchase decision | 68% |
| YouTube users who watched shopping-related videos (as of 2024) | 30 billion+ hours |
| Increase in watch time for videos that help people shop on YouTube(as of 2024) | 25% increase |
| Consumers are more likely to make purchases directly on YouTube | 39% |
| Gen Z consumers more likely to shop on YouTube | 68% |
This table shows YouTube as a Source for Product Information & Reviews
| Statistic | Percentage |
| Consumers who use YouTube to find product information | 92% |
| Consumers who ranked YouTube as their first choice for product reviews & information | 34% |
(Source- whop)
10,000+ brands grew faster with one tool.
By Creator Presence On YouTube
Content creation has become so popular that many people seek content creation as a full-time and sustainable job.
- As of December 2024, there are approximately 65.3 million YouTube creators worldwide.
- There has been significant growth in number of creators.
| Total active YouTube channels (including brands, studios, etc.) | More than 114 million |
| Channels with 100,000+ subscribers | Around 550,000 |
| YouTube channels with 1M+ subscribers | 60,000 |
This table shows YouTube Usage for Creator Content & Brand Interaction
| Statistic | Percentage |
| Consumers who used YouTube at least once a week to consume creator content | 86% |
| Consumers who interacted with brands they discovered on YouTube | 85% |
Consumer Behavior Influenced by YouTube
| Statistic | Percentage |
| Consumers who prepared a new food or beverage because of a YouTube video | 51% |
| Consumers who learned something interesting | 41% |
| Consumers who discovered a new musical artist or group | 40% |
| Consumers who purchased something | 35% |
| Consumers who repaired or assembled something | 35% |
| Consumers who discovered a new brand | 26% |
| Consumers who started a new routine or habit | 25% |
The table shows YouTube Video Upload Statistics
| Metric | Value |
| Videos uploaded per hour | 30,000 hours |
| Videos uploaded per minute | 500 hours |
| Total videos on YouTube | ~3.9 billion |
| YouTube Shorts videos | 826 million |
| Average video length | minutes 26 seconds |
This table shows YouTube Video Trends & Popular Content
| Category | Views Generated |
| “GRWM” (Get Ready With Me) videos | 13 billion |
| Generative AI-related videos | 1.7 billion |
| Barbie movie-related videos | 1 billion |
| YouTube Shorts daily views | 70 billion |
This table shows The YouTube Videos that had the highest number of views as of 2024
| Video | Views |
| Baby Shark Dance (music, kids) | 13.3 billion |
| Despacito (music) | 8.25 billion |
| Johny Johny Yes Papa (music, kids) | 6.78 billion |
| Bath Song (music, kids) | 6.38 billion |
| Shape of You (music) | 6.07 billion |
| See You Again (music) | 6.01 billion |
| Wheels on the Bus (music, kids) | 5.53 billion |
| Phonic Song with Two Words (music, kids) | 5.47 billion |
| Uptown Funk (music) | 5.02 billion |
| Learning Colors – Colorful Eggs on a Farm (music, kids) | 4.45 billion |
This table shows the channels having the highest number of subscribers (as of 2024)
| Channel | Subscribers |
| Mr. Beast | 352 million |
| T-Series (music) | 257 million |
| MrBeast (entertainment) | 228 million |
| CocoMelon – Nursery Rhymes (education) | 170 million |
| SET India (entertainment) | 167 million |
| Kids Diana Show (film) | 117 million |
| PewDiePie (entertainment) | 111 million |
| Like Nastya (entertainment) | 111 million |
| Vlad and Niki (entertainment) | 107 million |
| Zee Music Company (music) | 103 million |
| WWE (sports) | million |
Top creator earning via YouTube
| Metric | Value |
| Estimated net worth of MrBeast (Top Creator) | $105 million |
| Estimated annual earnings of MrBeast | $54 million |
This table shows YouTube Revenue & Monetization
| Metric | Value |
| Average earnings per 1,000 views | $1.61 – $29.3 |
| Average earnings per 1,000 views (general estimate) | $18 |
| Revenue share for long-form content (creators) | 55% |
| Revenue share for long-form content (YouTube) | 45% |
| Study of 6 YouTubers: earnings per 1,000 views | $2 – $12 |
(Source- demandsage, backlinko,(Source-wyzowl),(Source-analyzify),Business Insider, Source-analyzify),demandsage.com)
See what ZuAI generates from your website — right now.
Paste your URL. Watch ZuAI write a month of brand-on captions in seconds. Preview before you create an account.
By Engagement
- YouTube was ranked as the most time-consuming app among smartphone users (scoring best in engagement index) (as of March 2024-May 2024)
- YouTube was the most used social media app among smartphone users (as of March 2024 – May 2024)
This table Shows The General YouTube Engagement
| Metric | Value |
| YouTube monthly visits (April – June 2024) | 32 billion |
| YouTube had a daily open rate ( July 2024) | 64% |
| Percentage of users find YouTube more relaxing and entertaining than TV, streaming, and movies (as of 2024) | 26% |
| YouTube content watched on TV platforms daily (as of 2024) | 1 billion+ hours |
| YouTube Shorts receives 70 billion+ daily views (as of 2024) |
| Shorts within the 30-40-second range are the most popular (as of 2024) |
YouTube was the most used app in total time spent, ahead of Facebook & WhatsApp (March-May 2024)
This table shows YouTube User Behavior (Global)
| Metric | Value |
| Percentage of YouTube users who watch over 17 hours of video content weekly (as of 2024) | 27% |
| Percentage of YouTube visits come from desktop devices (as of 2024) | 12% |
This Table Shows YouTube Engagement in the U.S. (2024)
| Metric | Value |
| Percentage of Gen Z’s video engagement time spent on YouTube (as of 2024) | 29.3% |
| Percentage of overall YouTube Shorts traffic from the U.S.(as of 2024) | 19.4% |
| Percentage of U.S. internet users who access YouTube daily(as of 2024) | 62% |
| Most active YouTube users by age(as of 2024) | Spread across all age groups |
| 29% of Gen Z’s time spent engaging with online video is on YouTube (as of 2024) | 29% |
- YouTube has approximately 114 million YouTube channels in 2024.
- Only 4.4% of active YouTube users created their own YouTube channel(as of 2023).
(source –TimQueen)
This Table Shows YouTube Creators & Channel Performance
| Metric | Value |
| YouTube channels with 100K-1M subscribers have the highest engagement rate (as of 2024) | 3.47% |
| 90% of YouTube subscribers come from less than (as of 2024) | < 5% of channels |
| 60% of YouTube users are open to AI-generated content (as of 2024) | 60% |
| 52% of YouTube users have watched a VTuber (virtual YouTuber) (as of 2024) | 52% |
This Table Shows Engagement Rates of YouTube Channels by Follower Count
| Follower Count | Engagement Rate (%) |
| More than 1 million | 1.90% |
| 100,000 – 1 million | 3.47% |
| 1,000 – 5,000 | 3.40% |
(source-analyzify) (source-socialshephard) (source-webfx)(source-whop)
One coffee from URL to a full month of scheduled posts.
Drop your URL, brew your coffee, come back to 30 brand-on captions ready to publish.
By Revenue
YouTube contributes largely to the world’s GDP. It’s revenue is generated by Ads and In-App Purchases.
YouTube Revenue Statistics
| Statistic | Value |
| Percentage of Google’s ad revenues from YouTube | 6% |
| Average revenue per mile (long-form videos) | $3 |
| Average revenue per mile (short-form videos) | $0.05 |
| YouTube’s contribution to US GDP | $35 billion |
| U.S. YouTube in-app purchase revenue (January 2024) | $29 million |
The table below show You Tube’s Revenue via Ads
| Year | Revenue (by ads) |
| 2024 (H1) | $16.75 billion |
| 2023 | $31.5 billion |
| 2022 | $29.24 billion |
| 2021 | $28.8 billion |
| 2020 | $19.7 billion |
| 2019 | $15.1 billion |
| 2018 | $11.1 billion |
| 2017 | $8.1 billion |
| 2016 | $6.7 billion |
| 2015 | $5.5 billion |
| 2014 | $4.2 billion |
| 2013 | $3.1 billion |
| 2012 | $1.7 billion |
| 2011 | $1.3 billion |
| 2010 | $800 million |
The table below shows You Tube’s Revenue via In-App Purchases
| Country | YouTube (In APP Revenue) |
| United States | $28.29 million |
| Japan | $19.26 million |
| South Korea | $8.77 million |
| Australia | $2.82 million |
| Brazil | $2.77 million |
| United Kingdom | $2.49 million |
| Taiwan | $2.47 million |
| Hong Kong | $2.3 million |
| Canada | $2.02 million |
| Germany | $1.9 million |
(source-demandsage, backlinko)(source-globalmedianinsight)(source-analyzify)
Blank tab. Six open browsers. No clue what to post.
Paste one URL. Get 30 scheduled posts.
By App Download
YouTube App Download Statistics
| Statistic | Value |
| YouTube’s mobile app ranking worldwide (2023) | 3rd place with 182 million downloads |
| Total YouTube app downloads on Google Play Store | Over 10 billion |
| YouTube app downloads by iOS users in the U.S. (Apple App Store) | 5 million |
(source-webfx)(source-analyzify)
Spending 6 hours writing posts that get zero traction?
Paste your URL. ZuAI turns it into 30 brand-on captions in 10 minutes — no blank-page panic, no generic AI filler.
By Traffic
- YouTube gets the 2nd highest traffic in the world
- It gets 113 billion+ monthly site visits
YouTube Traffic by Country
| Country | Percentage of YouTube Traffic |
| United States | 16.4% |
| India | 9.2% |
| Japan | 4.8% |
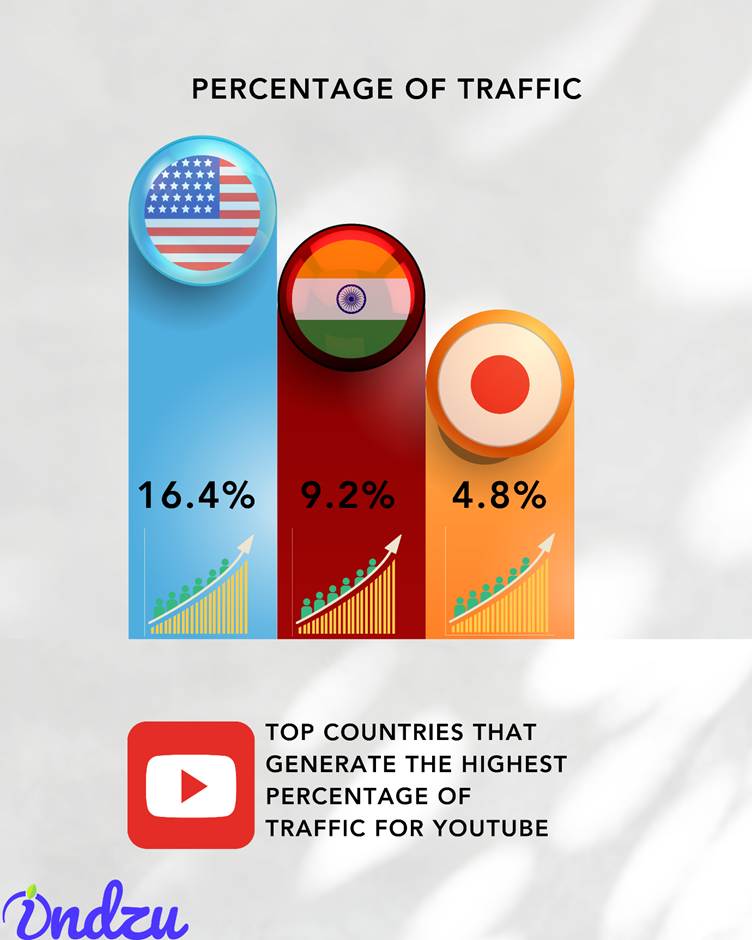
(source-analyzify)(source-globalmedianinsight)
Get 30 days of social content from your website — in 10 minutes.
By Number Of Employees
YouTube activity supports 390000 jobs in the USA (supporting an array of creator, managers or full-time employment)
| Year | Number of Employees |
| 2023 | 189,579 employees |
| 2022 | 186,779 employees |
| 2021 | 150,028 employees |
| 2020 | 118,899 employees |
| 2019 | 100,000+ employees |
| 2018 | 90,000+ employees |
Source-thumbnail,-analyzify)
10,000+ brands grew faster with one tool.
By Growth
As a brand, YouTube has shown a massive growth.
YouTube Brand Value Growth (2020-2024)
| Year | Brand Value (Billion USD) | Growth Since 2020 (%) |
| 2020 | 16.4 | 0% |
| 2021 | 17.3 | 5.5% |
| 2022 | 23.8 | 45.1% |
| 2023 | 29.7 | 81.1% |
| 2024 | 31.7 | 93% |
(Source-whop)
See what ZuAI generates from your website — right now.
Paste your URL. Watch ZuAI write a month of brand-on captions in seconds. Preview before you create an account.
The Ifs, Buts & The Pitfalls Of YouTube
There are many reasons why YouTube has negatively affected people.
| Pitfall | Key Issues |
| Exposure to Inappropriate Content | Algorithms fail to filter all inappropriate content, exposing young users to harmful material. |
| Addiction and Screen Time Concerns | Autoplay and personalized recommendations encourage excessive screen time, affecting sleep and productivity. |
| Misinformation and Fake News | False information spreads rapidly, impacting public perception and behavior. |
| Data Privacy Concerns | Extensive data collection raises privacy concerns, with limited user control over personal data. |
| Pressure on Content Creators | Creators face burnout due to constant content demands and algorithm-driven pressures. |
Challenges Faced by YouTubers
| Challenge | Percentage Affected |
| Difficulty in locating and engaging the audience | 30% |
| Issues with YouTube SEO | 30% |
| Finding relevant hashtags | 30% |
| Identifying ideal posting time | 30% |
YouTube has removed several channels. Here is the table showing YouTube Channel Removals (Q2 2024)
| Quarter | Number of Channels Removed |
| Q1 2024 | 15.79 million |
| Q2 2024 | 3.26 million |
Reasons for Video Removals on YouTube
| Reason for Removal | Percentage of Removed Videos |
| Child Safety Violations | 34% |
| Spam/Misleading Content | 5% |
| Cyberbullying & Harassment | 8% |
(Source-projectmanagers,demandsage)
One coffee from URL to a full month of scheduled posts.
Drop your URL, brew your coffee, come back to 30 brand-on captions ready to publish.
If We Sum Up
YouTube is popular across the world, but is majorly liked in India & USA. It is also popular among all age groups.
Businesses are either investing in YouTube or are planning to invest in YouTube. No one should miss this opportunity to be present on the best video marketing platform.
Do you want to know other social media stats? Check out our other blogs.