Last updated on

Social Media Stats
Social media was initially created to improve communication among people and make people connected around the whole world, But who knew that social media could change the ways of communication itself?
Today, we earn, learn, spend, socialize, create, and market via social media. Could anybody imagine that in the year 2000, this could have been an essential factor in a country’s economy?
Let us understand all the essential stats of social media and understand why it is a buzz today.
Social Media Usage Trends
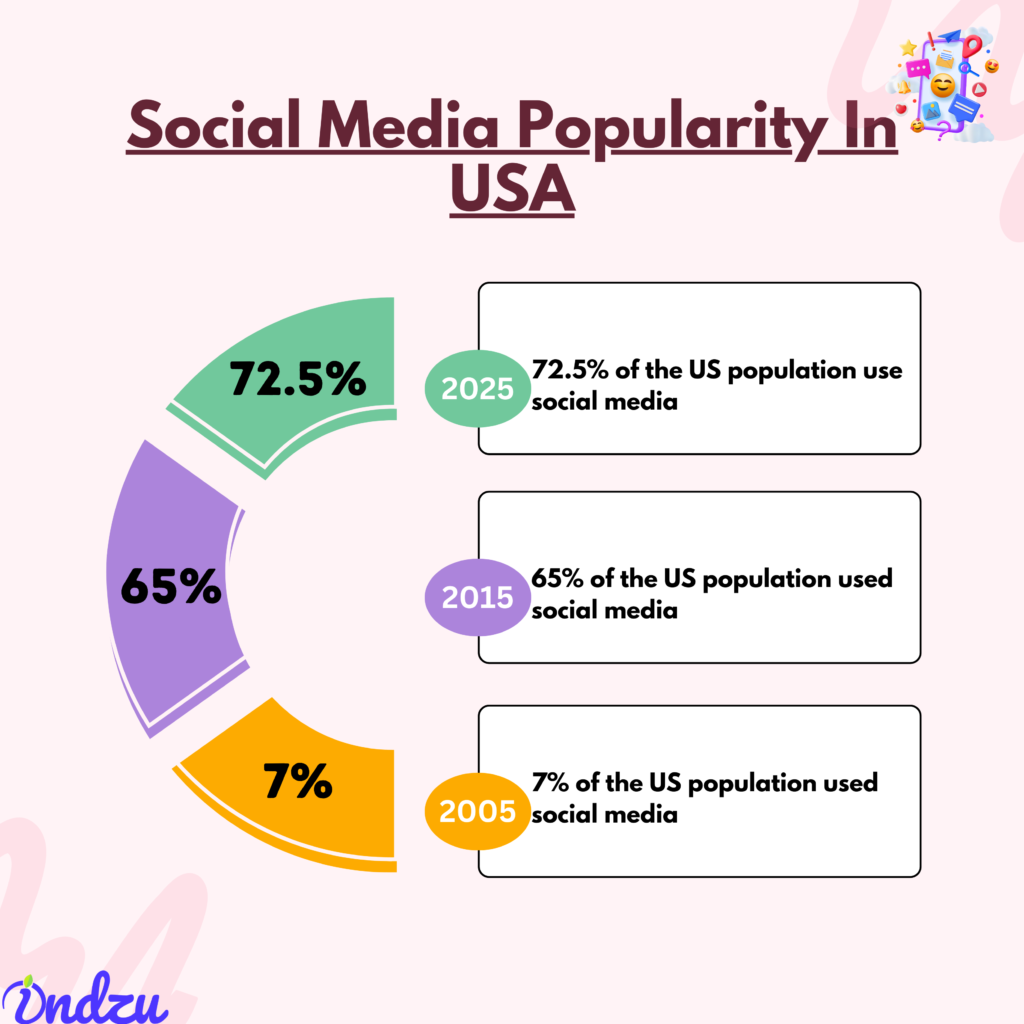
Did you know in 2005, Only 7 % of the US population used social media and that number has increased to 72.5% in 2025?
| 2005 | 7% of the US population used social media |
| 2015 | 65% of the US population used social media |
| 2025 | 72.5% of the US population use social media (221.71 million active users) |
- Most of the social media platform headquarters are located in the USA.
| Platform | Founded Year | Headquarters |
| 2004 | Menlo Park, California, USA | |
| 2010 | Menlo Park, California, USA | |
| 2002 | Sunnyvale, California, USA | |
| YouTube | 2005 | San Bruno, California, USA |
| 2010 | San Francisco, California, USA | |
| Google My Business (GMB) | 2014 | Mountain View, California, USA |
| TikTok | 2016 | Beijing, China (Owned by ByteDance) |
- My Space was the first social media platform to reach 1 million monthly active users in 2024.
- The number of social media users has increased by
| Social Media | Users in 2010 | Users in 2025 |
| 600 Million(approx.) | 3.05 billion | |
| 50 Million | 1.40 billion | |
| YouTube | 700 Million | 2.70 Billion |
| 50 Million | 537 million | |
| NA | 1.15 Billion |
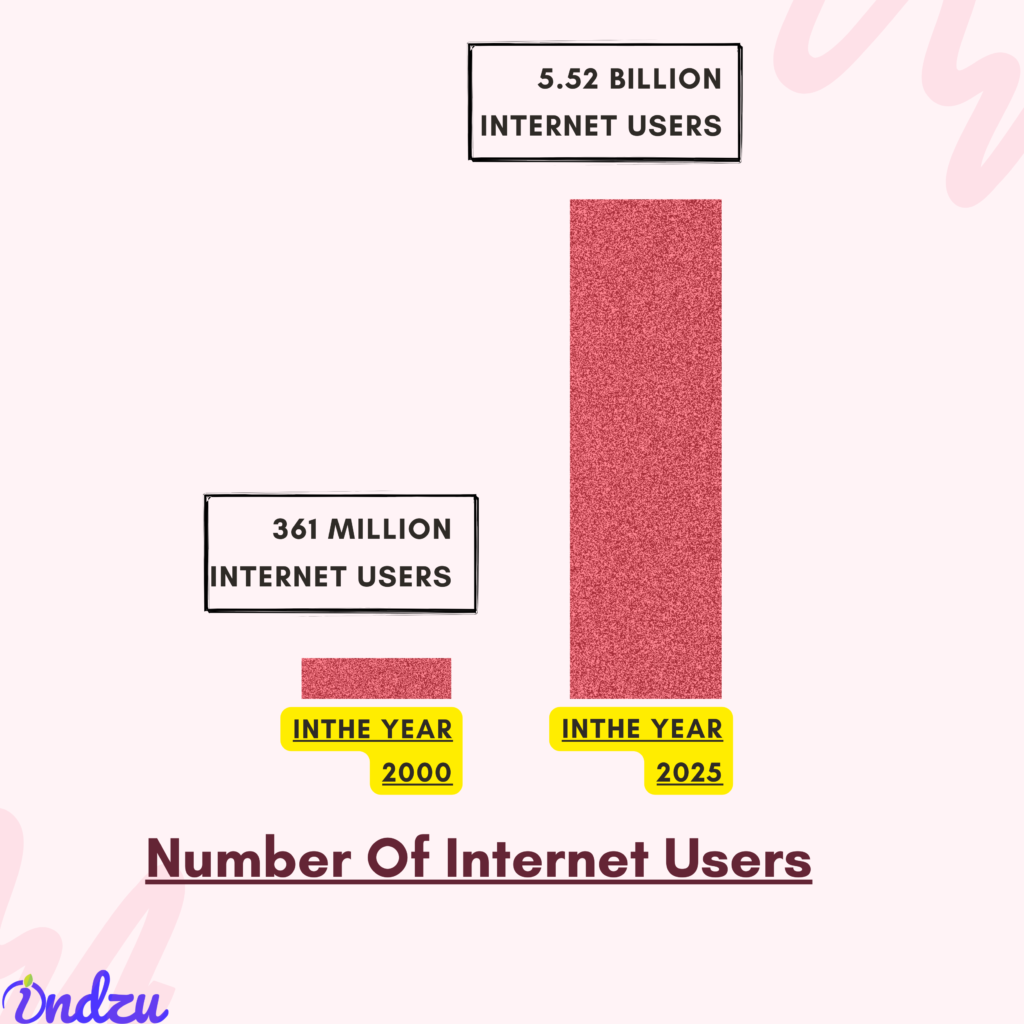
- Social media usage has increased as more and more people have access to an internet connection.
| In 2000 | 361 million internet users |
| In 2025 | 5.52 billion people internet users |
In 2025, approximately 67.5% of the whole population has internet access and 95% of the internet users worldwide use social media.
| 67.5% of the whole population has internet access |
| 95% of the internet users use social media |
Top reasons for social media usage
| Reason for Using Social Media |
| Keeping in touch with friends & family(50.8%) |
| Filling spare time |
| Reading news stories(34.5%) |
| Entertainment & content consumption |
| Seeking inspiration & ideas |
| Online shopping & social commerce |
| Sense of belonging & community |
| Professional networking & learning |
| Self-expression & validation |
| Escapism & stress relief |
The number of social media users has always kept on increasing.
|
Year |
Number of Social Media Users (in billions) |
|
2017 |
2.73 |
|
2018 |
3.10 |
|
2019 |
3.51 |
|
2020 |
3.91 |
|
2021 |
4.26 |
|
2022 |
4.59 |
|
2023 |
4.90 |
|
2024 |
5.17 |
|
2025 |
5.52 |
|
2026(expected) |
5.65 |
|
2027(expected) |
5.85 |
|
2028 (expected) |
6.05 |
The gender distribution of social media users
The gender split for all social media users (globally) is relatively even
| Male | 48.4% |
| Female | 51.6% |
Social media has penetrated in many regions.
| World Region | Social Media Penetration Rate |
| Northern Europe | 82% |
| Western Europe | 80% |
| Southern Europe | 75% |
| Eastern Asia | 74% |
| Northern America | 71% |
| Eastern Europe | 70% |
| Western Asia | 66% |
| Central America | 65% |
| Southeastern Asia | 60% |
| Oceania | 60% |
| Caribbean | 51% |
| Southern Africa | 42% |
| Southern America | 42% |
| Northern Africa | 40% |
| Central Asia | 35% |
| Southern Asia | 32% |
| Western Africa | 16% |
| Eastern Africa | 10% |
| Middle Africa | 9% |
| Global | 62% |
In India, the average person has 11.4 social media accounts per person.
| Country | Average Social Media Accounts Per Person |
| India | 11.4 |
| The United States | 7.1 |
| The United Kingdom | 6.9 |
| Canada | 6.8 |
| Japan | 3.8 |
Maximum people use social media via their mobile devices
| Mobile device usage | 98% |
| Desktop usage | 2% |
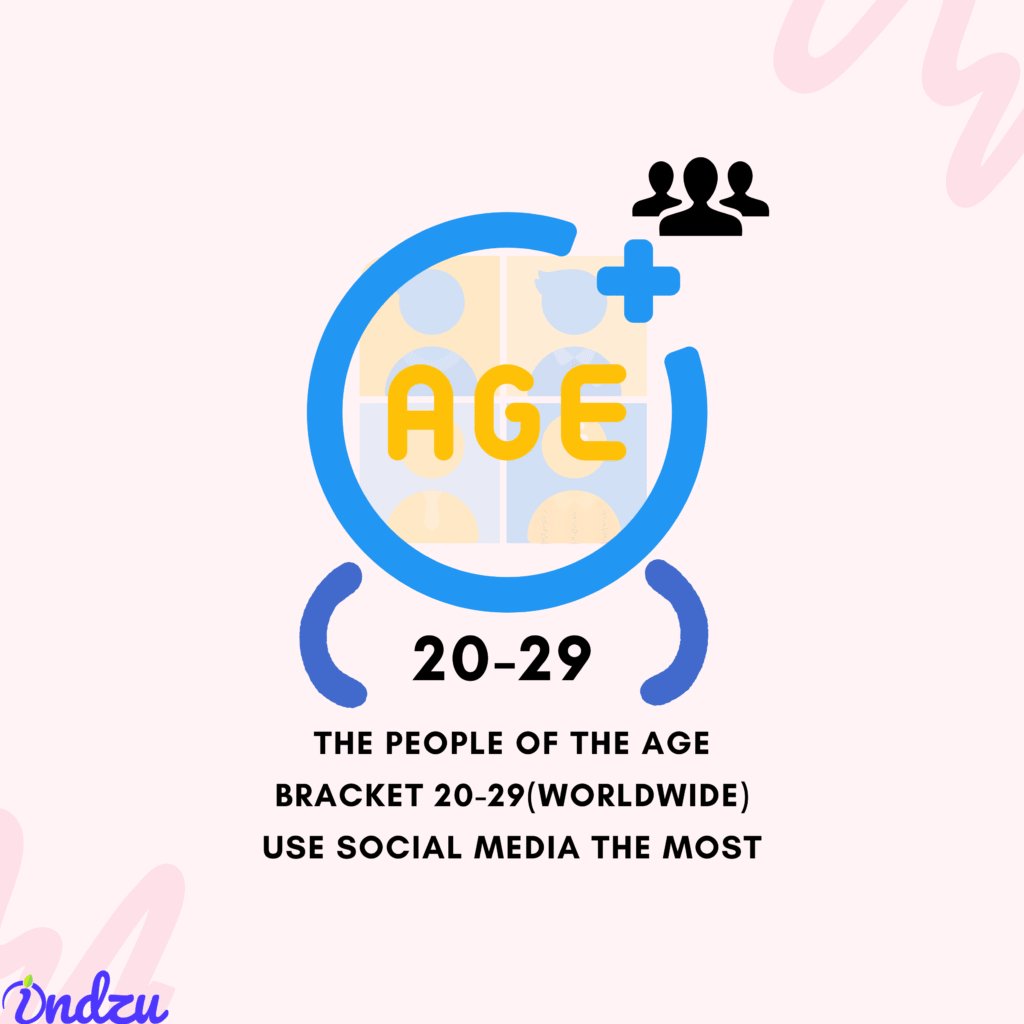
The people of the age bracket 20-29(worldwide) use social media the most
| Age Group | Social Media Users (%) |
| 13-19 | 12.7% |
| 20-29 | 31.8% |
| 30-39 | 21.9% |
| 40-49 | 15.0% |
| 50-59 | 10.0% |
| 60+ | 8.6% |
We can compare this trend with the initial years when social media platforms were newly launched.
Even in the initial days of the social media launch era, the age bracket of 18-29 was the most active. This table shows the percentage of users according to the age bracket.
| Year | 18-29 | 30-49 | 50-64 | 65 or older |
| 2005 | 10 | 5 | 2 | 1 |
| 2006 | 30 | 10 | 5 | 2 |
| 2007 | 50 | 25 | 10 | 3 |
| 2008 | 65 | 40 | 20 | 5 |
- Source-obrelo, priordata, researchgate, demandsage, pingdom,datreportal,globalstatistics,–(stackscale)(source-ourworldindata)(source-statista)
Social Media Usage Trends In USA
72.54 % of the US population is active on social media.
| Total population of US | 339.1 million |
| Number of Internet users | 311.3 million (91.8% of total population) |
| Active social media users | 246.0 million |
| Number of Mobile Internet users | 282.34 million |
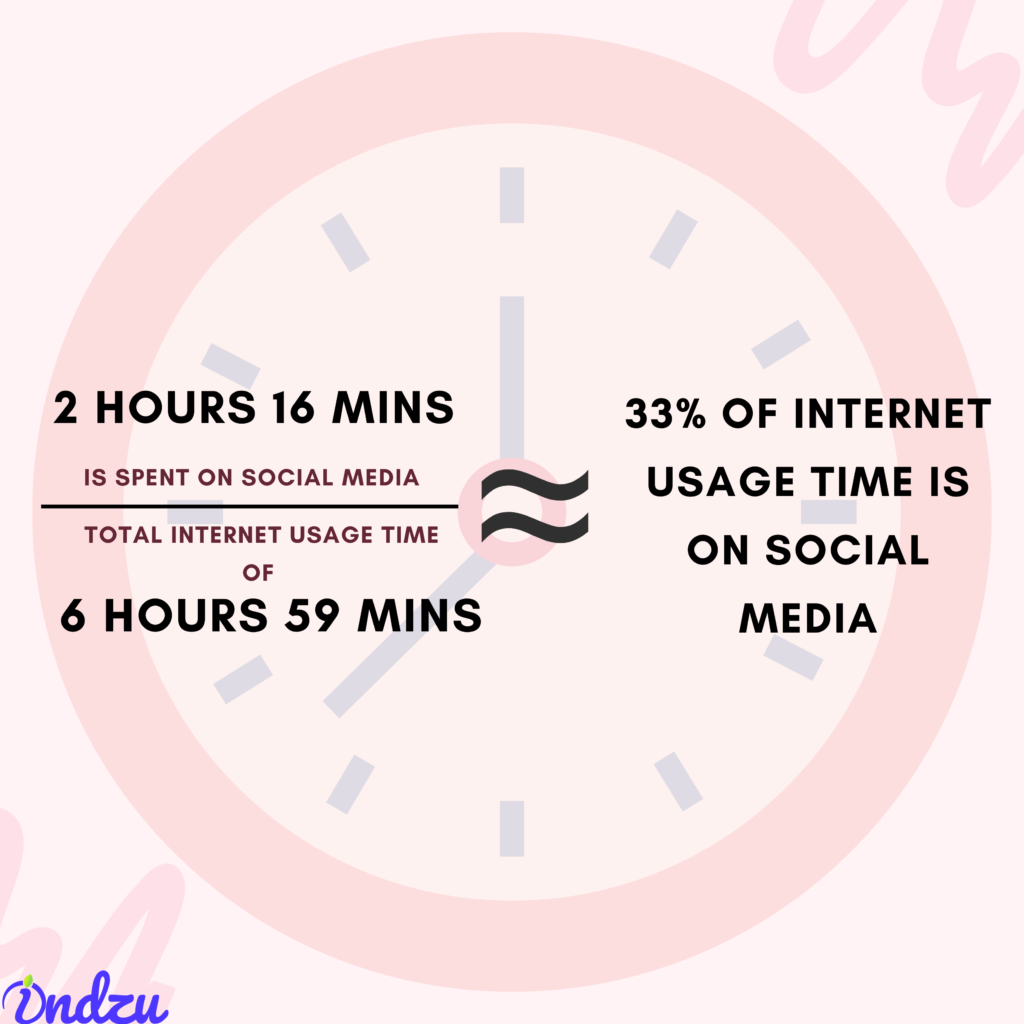
33 % (approx.) of the internet time is spent on social media.
| Average daily time spent using the Internet | 6 hours 59 mins |
| Average daily time spent using Social Media | 2 hours 16 mins |
Facebook is the most used social media platform
| Most Used Social Network Platforms | Percentage | Active Users (in millions) |
| 74.20% | 221.71 | |
| 60.50% | 180.77 | |
| Tik Tok | 47.00% | 140.44 |
| X (Twitter) | 42.30% | 126.39 |
| 37.00% | 110.56 | |
| 29.90% | 89.34 | |
| 29.30% | 87.55 | |
| Skype | 15.00% | 44.82 |
| Nextdoor | 13.50% | 40.34 |
In America, people use a lot of messaging apps. FB Messenger is the most used messaging app.
| Most Used Messenger Apps in the US | Percentage | Active Users (in millions) |
| Facebook Messenger | 60.30% | 180.18 |
| I Message | 39.50% | 118.03 |
| Snapchat | 37.40% | 111.75 |
| 27.30% | 81.57 | |
| Discord | 15.70% | 46.91 |
| Telegram | 13.50% | 40.34 |
Young people tend to spend more time on social media.
| Age Group | Share of Users (Percentage of age bracket using Social Media) |
| 18 to 29 Years | 84% |
| 30 to 49 Years | 81% |
| 50 to 64 Years | 73% |
| Over 65 Years | 45% |
Females are more active on social media rather than males.
| Gender | Percentage |
| Female | 78% |
| Male | 66% |
Let Us Have A Closer Look
Facebook started in 2004; META owns it and is just 20 years old. It is the largest social media platform
It is used by 3.05 billion people (monthly) all over the world.
In the regions of Southern Asia and Southern America maximum number of active Facebook users is present
| Region | Active Facebook Users (millions) |
| Southern Asia | 496.3 |
| Southeastern Asia | 415.2 |
On average, a person spends 30.9 minutes on Facebook. It ranks 3rd in terms of time spent on any social media platform.
The most significant number of Facebook users are in the 25 to 34-year & 18- to 24-year-old age bracket.
| Age Group | Number of Users (billions) |
| 25 to 34 years | 1.01 |
| 18 to 24 years | 0.727 |
Males are more active on Facebook than females.
| Males | 56.8% of Facebook users |
| Females | 43.2% of Facebook users |
Indians and Americans love Facebook the most. A maximum number of users are present in these countries.
| Country | Facebook Audience (in millions) |
| India | 378.05 |
| United States | 193.8 |
Top reasons why people use Facebook
| Reason | Percentage of People |
| Message friends and family | 72.4% |
| Post or share photos or videos | 63.2% |
On average, industries post 4.69 posts / a week on Facebook.
The industries that are most active on Facebook are
| Media | 64.6 |
| Sports Teams | 24.3 |
| Higher Education | 6.2 |
Facebook has seen growth in each quarter. Facebook’s monthly active users have risen by 7.18% year-over-year.
Facebook gets a reasonable engagement rate from users
| Post Type | Engagement Rate (%) |
| Photo Posts | 43.75 |
| Video Posts | 28.75 |
| Album Posts | 27.50 |
Every year, Facebook has seen a growth in revenue generation. Facebook’s net income for Q1 2024 was $12.37 billion, which was a remarkable 117% increase from Q1 2023
| Year | Revenue (in million USD) |
| 2023 | 134,902 |
| Q1 2024 | 39,070 |
| Q2 2024 | 36,460 |
Facebook was the third most downloaded app globally in 1st quarter of 2024.
Facebook for Business And Marketing
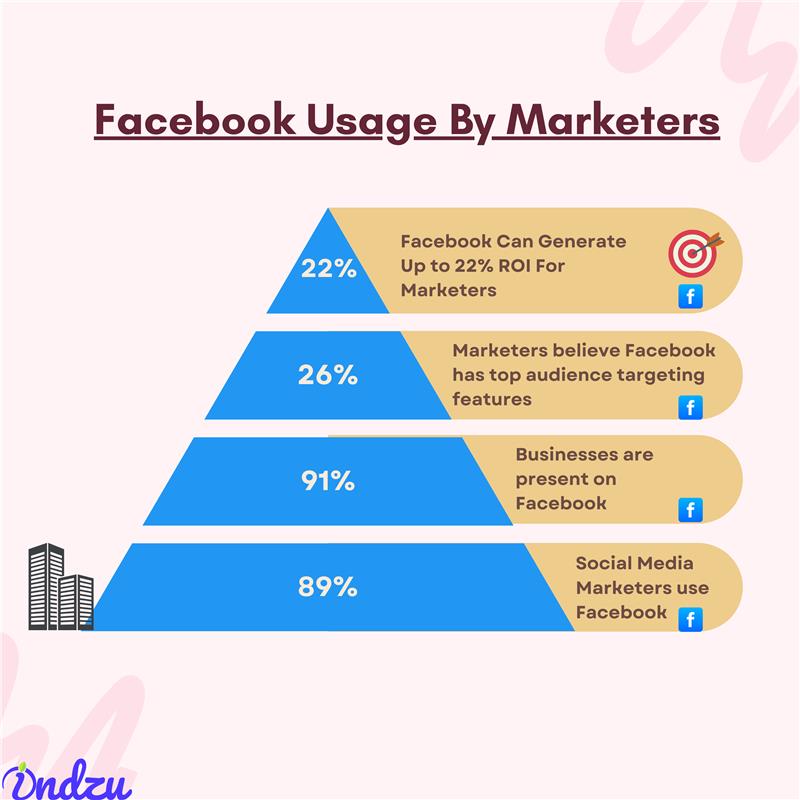
Facebook is the second most loved channel for generating ROI.
| 22% ROI |
B2B marketers like Facebook the most.
Businesses and marketers like Facebook, as it is an excellent platform for their marketing platforms.
| Statistic | Percentage |
| Businesses already present on Facebook | 91% |
| Marketers who believe Facebook has top audience targeting features | 26% |
| Social Media Marketers using Facebook for business promotion | 89% |
2.24 billion people can be reached via Facebook ads.
Facebook ads had an impressive reach of 131.1% in Libya.
| Country | Facebook Audience Reach (%) |
| Libya | 131.1% |
| U.A.E. | 120.5% |
| Mongolia | 116% |
There are 8 million active Ad users on META platforms.
Future Predictions of Facebook (in terms of USA users)
| Year | Facebook Users in the USA (in millions) |
| 2028* | 262.8 |
| 2027* | 259.86 |
| 2026* | 256.78 |
Future predictions of Facebook in terms of Ad revenue.
| Year | Facebook Ad Revenue Forecast (in Billions USD) |
| 2025 | $187.35 |
| 2026 | $202.94 |
Instagram was launched in 2010. META owns it. It is only 14 years old.
It has 2 Billion active users (monthly). 1.40 billion daily active users use it.
Asia-Pacific and Europe regions have the maximum number of Instagram users.
| Region | Users (millions) |
| Asia-Pacific | 893 |
| Europe | 338 |
Just like Facebook, Indians and Americans love Instagram the most.
| Country | Instagram Audience Size (in Millions) |
| India | 362.9 |
| United States | 169.65 |
An average Android user spends 33.9 minutes daily (16 hours 56 minutes per month) on the Instagram app.
In the USA the age group of 18-24 & 25-34 spends the maximum time on Instagram.
| 18-24 | 53 minutes |
| 25-34 | 37 minutes |
50% + of the global Instagram population was 34 years or younger.
Male users dominate Instagram.
| Age Group | Female Users (%) | Male Users (%) |
| 18–24 | 15.2 | 16.5 |
| 25–34 | 14.2 | 16.4 |
Most people love to use Instagram to post or share videos
| Activity Of Instagram Users | Percentage (%) |
| Post or share photos or videos | 70.1 |
| Look for funny or entertaining content | 66.6 |
| Follow or research brands and products | 62.3 |
| Message friends and family | 59.7 |
| Keep up to date with news and events | 54.4 |
On average, brands post 4.6 posts /per week on Instagram.
The top categories who post maximum on Instagram are
| Industry | Posting Frequency |
| Higher Ed | 3.9 posts per week |
| Sports Teams | 15.6 posts per week |
| Influencers | 4.1 posts per week |
The average growth rate of Instagram monthly active users is approximately 26%
| Year | MAU (Monthly Active Users) |
| 2024 | 2.1 billion |
| 2023 | 2.08 billion |
Instagram gets an average engagement rate of 0.56% on all types of content formats.
| Instagram post type | Average Instagram engagement rate |
| All Post Types | 0.56% |
| Photo Posts | 0.50% |
| Video Posts | 0.55% |
| Carousel Posts | 0.69% |
In 2023, Instagram had generated a revenue of 60 Billion.
| Year | Revenue in Billions |
| 2021 | 48 |
| 2022 | 51 |
| 2023 | 60 |
Instagram app has been downloaded approximately 3.8 billion times, making itself the 4rth most downloaded app(as of 2025)
Instagram For Business And Marketing
Over 200 million businesses and 86% of organizations are actively present on Instagram.
30% of the marketers say that Instagram gives them the best ROI.
|
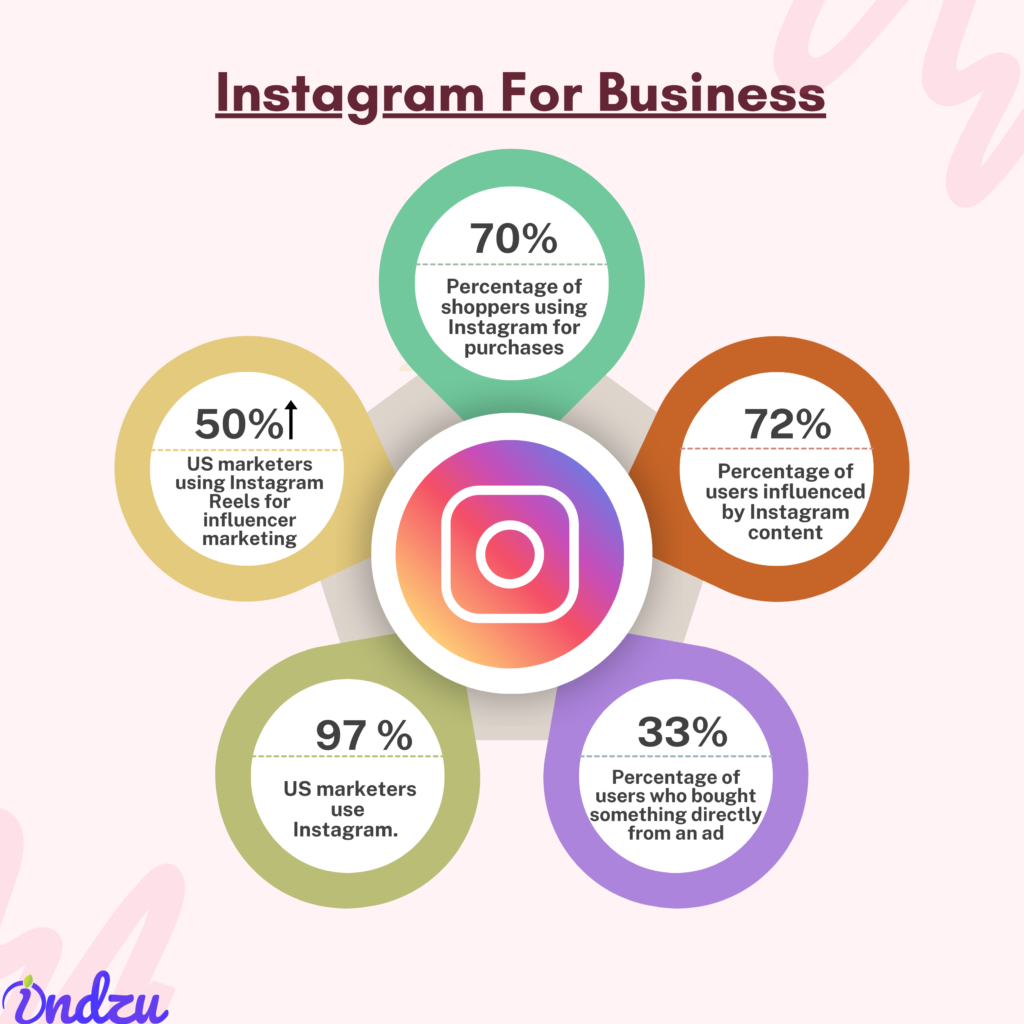
Percentage of shoppers using Instagram for purchases |
70% |
|
Percentage of users influenced by Instagram content |
72% |
|
Percentage of users who bought something directly from an ad |
33% |
(a) 97 % of US marketers use Instagram.
(b) Marketers use Instagram reels and DM features for marketing
| Percentage of US marketers using Instagram Reels for influencer marketing | More than 50% |
| The conversion rate for brands using Instagram DMs | 70% |
In April 2023, Instagram Ads could reach 1,628 million people.
Instagram For Influencers
Instagram is the 2nd best platform for Influencer marketing.
46.7% of brands use Instagram influencer marketing in 2024.
Instagram Influencer marketing will reach $22.2 billion by the end of 2025
Women comprise 77% of influencers on Instagram.
In 2024, Instagram had 20,100 employees, which was 2,100 more or approximately 12 % more than in 2023.
YouTube
YouTube was launched in 2005. It is just 20 years old and is owned by Google
YouTube is the 2nd largest search engine. It is used by 2.70 billion people (monthly) and 122+ million people daily. 68. 47% of the internet users use YouTube.
YouTube is available in 80+ languages.
5 Billion + Videos are watched daily on YouTube.
| Hours of new videos are uploaded daily | 720,000 hours |
| Total videos watched per day | 5 billion+ videos |
| Average video length | 12m 26s |
YouTube gets 25 % of all mobile traffic.
YouTube Premium & Music Subscribers
| Statistic | Value |
| Total YouTube Premium & Music subscribers | 80 million+ |
| U.S. YouTube Premium & Music subscribers | 27 million+ |
| Countries/regions with YouTube Premium & Music | 100+ |
Southern Asia and Southeast Asian regions have the maximum number of YouTube users
| Rank | Region | Number of Users (in millions) |
| 1 | Southern Asia | 580.1 |
| 2 | Southeastern Asia | 332.6 |
Indians and Americans love YouTube the most, as do users from other countries.
| Rank | Country | Number of Users (in millions) |
| 1 | India | 637.1 |
| 2 | USA | 238 |
| 3 | Russia | 95.38 |
90% of YouTube visits from users worldwide were from mobile and smartphone devices.
Average user spent 19 minutes on YouTube.
| Average daily time spent on YouTube | 19 minutes |
| Average mobile viewing session | 40+ minutes |
Worldwide, more males use YouTube. However, in the U.S.A., more females use YouTube.
| Region | Female Users (%) | Male Users (%) |
| USA | 51.4% | 48.6% |
| Global | 45.6% | 54.4% |
The age bracket of 25-34 has the highest number of users on YouTube.
| Age Bracket( 25-34) | 9.4% | 12.1% |
| Age Bracket (35-44) | 8.1% | 9.8% |
77.7 % of the adult population (18+) uses YouTube.
Reasons for YouTube usage
| Statistic | Value |
| Top 100 searches related to music | 20% |
| Most popular languages on YouTube | English & Spanish |
| YouTube as primary podcast destination (US) | 31% (Spotify: 21%, Apple Podcasts: 12%) |
| Teachers incorporating YouTube into lessons | 86% |
| People using YouTube for entertainment | 82% |
| People using YouTube to follow brands/companies | 18% |
| People using YouTube for professional work | 7% |
| Viewers (30-49) using YouTube as a news source | 37% |
YouTube For Business And Marketing
YouTube is the best platform for video marketing. 91% of companies use video marketing
| Statistic | Percentage |
| Businesses with a YouTube channel that gained a loyal following | 83% |
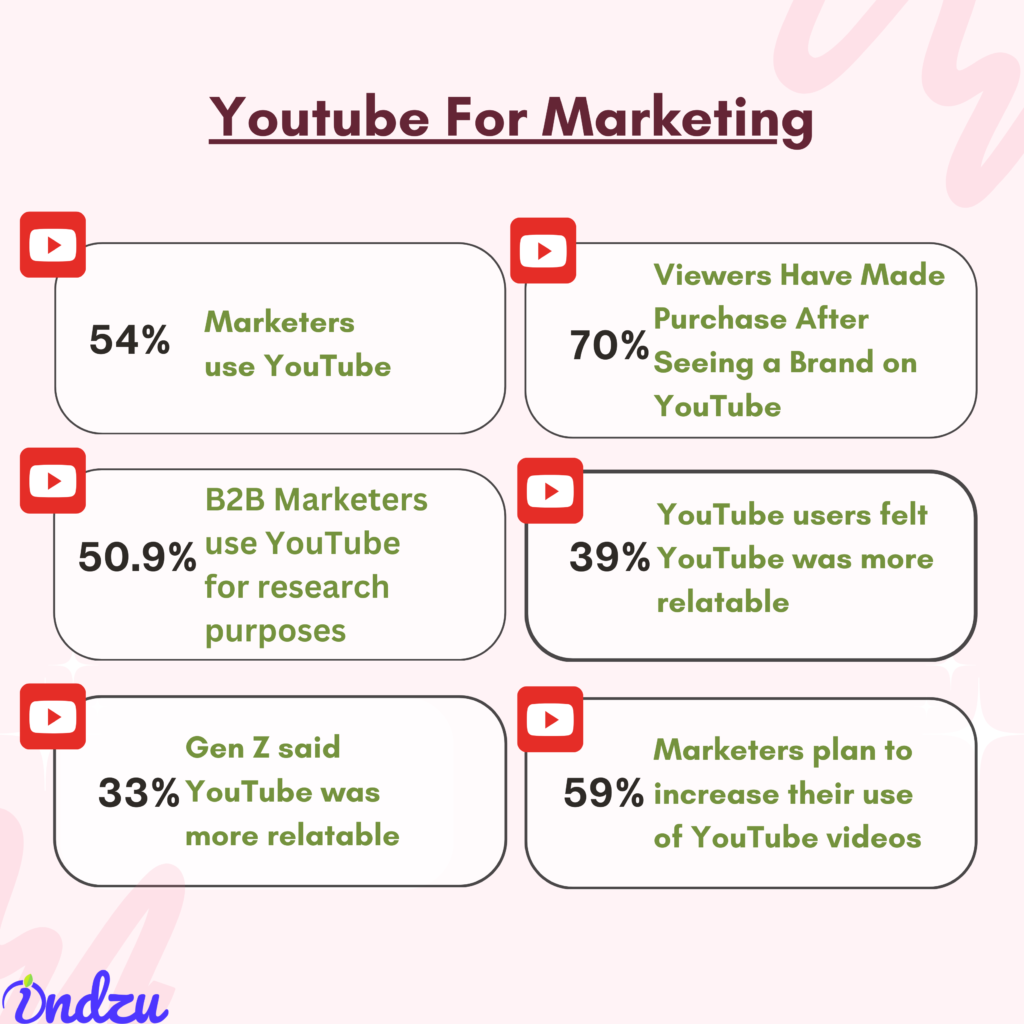
| Viewers who purchased after seeing a brand on YouTube | 70% |
| Businesses that agree YouTube is vital for business growth | 78% |
Companies are spending millions on YouTube for marketing
| Company | Advertising Spending (Million USD) |
| Apple Inc | 237.15 |
| Disney | 177.76 |
| Donald J. Trump for President | 146.29 |
| Biden for President | 115.76 |
YouTube ranked second as a platform where consumers came to spend money after seeing something
| YouTube is the most used social platform for research purposes among B2B decision-makers | 50.9% |
| 54% of marketers use YouTube (as of 2023) | 54% |
| 59% of marketers plan to increase their use of YouTube videos (as of 2023) | 59% |
YouTube is the 2nd best platform for influencer marketing.
| 70% of Viewers Have Made a Purchase After Seeing a Brand on YouTube | 70% |
| 39% of YouTube users felt YouTube was more relatable | 39% |
| 56% of Gen Z said YouTube was more relatable | 56% |
| 33% of viewers said YouTube was more influential than traditional TV, streaming, or movies (as of 2024) | 33% |
Between 2010 to 2023, YouTube’s Ad revenue increased by 3,838% from $0.8 billion to $31.5 billion.
YouTube Ads have a huge reach.
| YouTube’s total potential ad reach (as of 2024) | 2.5 billion |
| YouTube’s ad reach among users aged 18+(as of 2024) | 2.17 billion |
52% of marketers use paid ads on YouTube (as of 2024)
| Marketers using paid ads on YouTube (as of 2024) | 52% |
| Marketers allocating over 51% of the budget to YouTube (as of 2024) | 21% |
| Marketers planning to increase YouTube marketing budget (as of 2024) | 65% |
YouTube has helped a lot of E-Commerce businesses to make profits
| Consumers are more likely to make purchases directly on YouTube | 39% |
| Consumers who use YouTube to find product information | 92% |
| Consumers who ranked YouTube as their first choice for product reviews & information | 34% |
YouTube For Creators
As of December 2024, there are approximately 65.3 million YouTube creators worldwide.
More than 114 million YouTube channels are present. (as of 2024)
4 Billion videos are present on YouTube. The table below shows some more interesting facts about YouTube videos.
| Metric | Value |
| Videos uploaded per hour | 30,000 hours |
| Videos uploaded per minute | 500 hours |
| Total videos on YouTube | ~3.9 billion |
| YouTube Shorts videos | 826 million |
YouTube gets 32 Billion monthly visits. The daily open rate of YouTube is 64%
| YouTube monthly visits (April – June 2024) | 32 billion |
| YouTube had a daily open rate ( July 2024) | 64% |
YouTube Shorts receives 70 billion+ daily views (as of 2024)
LinkedIn was launched in 2003. It is 21 years old and is owned by Microsoft.
LinkedIn is considered to be the most professional social media networking platform. There are 1.15 Billion users on LinkedIn worldwide.
The North American & Southern American regions have the maximum number of LinkedIn users.
| Region | Population (in millions) |
| Northern America | 224.0 |
| Central America | 26.1 |
The U.S.A. and India have the maximum number of LinkedIn users.
| Country | Number of LinkedIn users in 2024 |
| 1. United States | 240 million |
| 2. India | 140 million |
In 2024, LinkedIn had 1.15 billion active users, which is 15% more than the previous year.
| Year | Monthly Active Users |
| 2024 | 1.15 billion |
| 2023 | 1 billion |
Maximum number of LinkedIn users are from the age group of 25-34.
| Age Group | Share Of LinkedIn Users |
| 25-34 | 50.6% |
| 18-24 | 24.5% |
41% of millionaires use LinkedIn.
92 % of the Fortune 500 companies use LinkedIn.
On average, users spend 7.27 minutes and 38 seconds per LinkedIn visit.
Males use LinkedIn more than females.
| Males | 56.8% of LinkedIn users |
| Females | 43.2% of LinkedIn users |
People use LinkedIn for various purposes
| Purpose of LinkedIn | Percentage of users who list it as a reason they use LinkedIn |
| 1. Keep up to date with news and current events | 28.7% |
| 2. Follow or research brands and products | 25.1% |
| 3. Post or share photos or videos | 15.6% |
| 4. Message friends and family | 12.2% |
| 5. Look for funny or entertaining content | 10.6% |
LinkedIn has 175 million premium users.
Premium sign-ups have increased by 51% in fiscal year 2024, with new AI tools adding more value
The number of LinkedIn users has consistently grown.
| 2022 | 830 |
| 2023 | 930 (As of Q1 of 2023) |
| 2024 | 1150 |
LinkedIn For Business And Marketing
A Total of 413 industries have subscribed to the LinkedIn sales navigator mode
LinkedIn is the best platform for getting organic reach. 99.63% of LinkedIn search traffic comes from organic search.
Businesses who post regularly on LinkedIn observe 5.6x times growth.
Nearly 10% of brands post more than 10 times / a week.
The average engagement rate by impression on LinkedIn is 4.73%.
One hundred million messages are sent daily on LinkedIn.
In 2023, LinkedIn generated 16.32 billion dollars in revenue.
65 % of the global marketers use LinkedIn for marketing
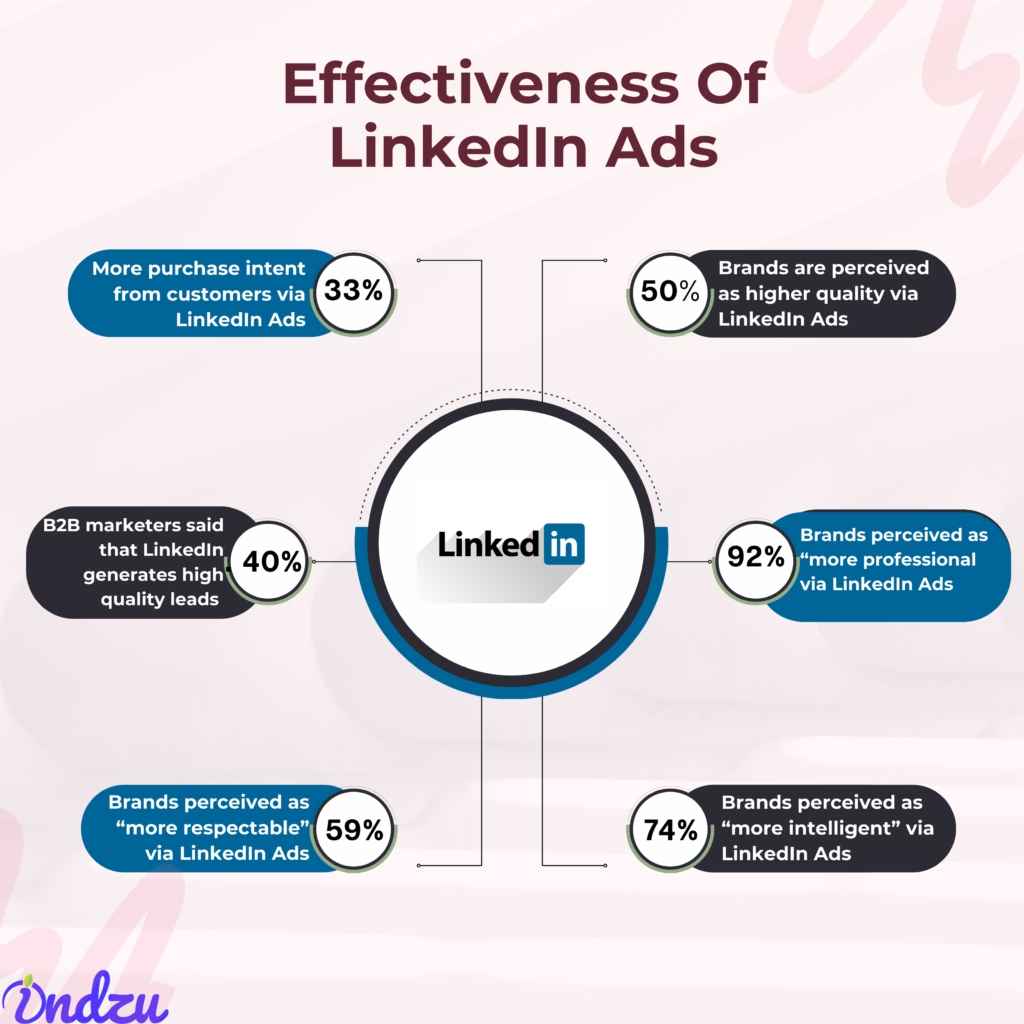
40% of B2B marketers said that LinkedIn can most effectively generate high-quality leads
By marketing on LinkedIn, brands can improve their image.
| Metric | Value |
| Brands perceived as higher quality after advertising on LinkedIn | 50% |
| Brands perceived as “more professional” | 92% |
| Brands perceived as “more intelligent” | 74% |
| Brands perceived as “more respectable” | 59% |
LinkedIn ads have helped brands to get 33% more purchase intent from customers
LinkedIn Conversation Ads drive four times higher open rates and engagement rates than traditional email and twice the engagement as Message Ads
666.3 million users who use LinkedIn as an advertising medium
43% of the LinkedIn advertisement audience is women, while 57% are male
14.6% of the world’s population is reachable by LinkedIn ads.
LinkedIn For Recruiting & Learning
LinkedIn is being used by 97% of HR and staffing professionals. Many job applications are submitted every second on LinkedIn
| Open jobs on LinkedIn | Over 14 million |
| Job applications submitted every second on LinkedIn | 81 |
| Total job applications submitted every month on LinkedIn | 210M+ |
Thirteen thousand organizations in the world use LinkedIn Learning.
| Metric/Information | Value/Details |
| LinkedIn Learning courses available | Over 20,000 courses in seven languages |
| LinkedIn Learning offers | Over 16,000 courses |
Companies using sales navigator in LinkedIn get a 17% higher win rate on average.
In 2023, LinkedIn had 20000 employees.
Pinterest was launched in 2010. It is just 15 years old and is a public company.
Pinterest is the 15th most popular social media platform.
North America and South America regions have the maximum number of Pinterest users.
| Region | Pinterest Users (in millions) |
| Northern America | 93.0 |
| Southern America | 44.7 |
There are 537 million active users on Pinterest on a monthly basis. It is used by around 6.4% of the world’s population.
Pinterest has one of the highest customer satisfaction scores. With a score of 74/100 (among online network companies), it scores according to the American Customer Satisfaction Index (ACSI).
The U.S.A. and Brazil love Pinterest the most
| Country | Audience Size (in millions) |
| United States | 89.9 |
| Brazil | 38.93 |
Pinterest Is widely popular among females.
| Gender | Percentage of Pinterest Users | Number of Users (in thousands, assuming 100,000 total users) |
| Women | 69.4% | 69,400 |
| Men | 22.6% | 22,600 |
| Unspecified | 8.0% | 8,000 |
People happily spend time on Pinterest
| Metric | Value |
| Average time spent per month | 1 hour 49 minutes |
| Average session duration | 2 minutes 11 seconds |
The age bracket of 18-24 uses Pinterest the most.
| Age | Percentage Of Users |
| 18 to 24 years | 29.6% |
| 25 to 34 years | 27.3% |
| Age Group | Percentage of Users in the US (%) |
| 18-24 (Gen Z) | 46% |
| 25-34 | 40% |
Purpose of use of Pinterest
| Activity | Percentage (%) |
| Entertaining content | ~20% |
| Brands & products | ~40% |
| New & current events | ~15% |
| MSG family | ~10% |
| Post or share | ~10% |
A good Engagement Rate On Pinterest Is Around 1% To 2%.
Nearly 1 billion Videos are viewed daily on Pinterest.
|
Metric |
Value |
|
Videos viewed daily on Pinterest |
Nearly 1 billion |
|
Pins saved weekly on Pinterest |
Over 1.5 billion |
|
Total ideas saved on Pinterest to date |
Over 500 billion |
|
Total pins present |
10 billion |
Pinterest generated 1.594 billion revenue in 2024 (Q1 + Q2)
| Year | Revenue |
| 2024 (Q1+Q2) | 1.594 billion |
Pinterest Business & Marketing
Branded or Unbranded does not make a difference on Pinterest. 97% Of The Top Pinterest Searches Are Unbranded
People discover new products on Pinterest
| Weekly Users Discovering New Brands/Products | 46% |
| Users Feeling Positive About Pinterest | 8 in 10 |
| Likelihood to Click and Visit Brand Website | 3x More Likely |
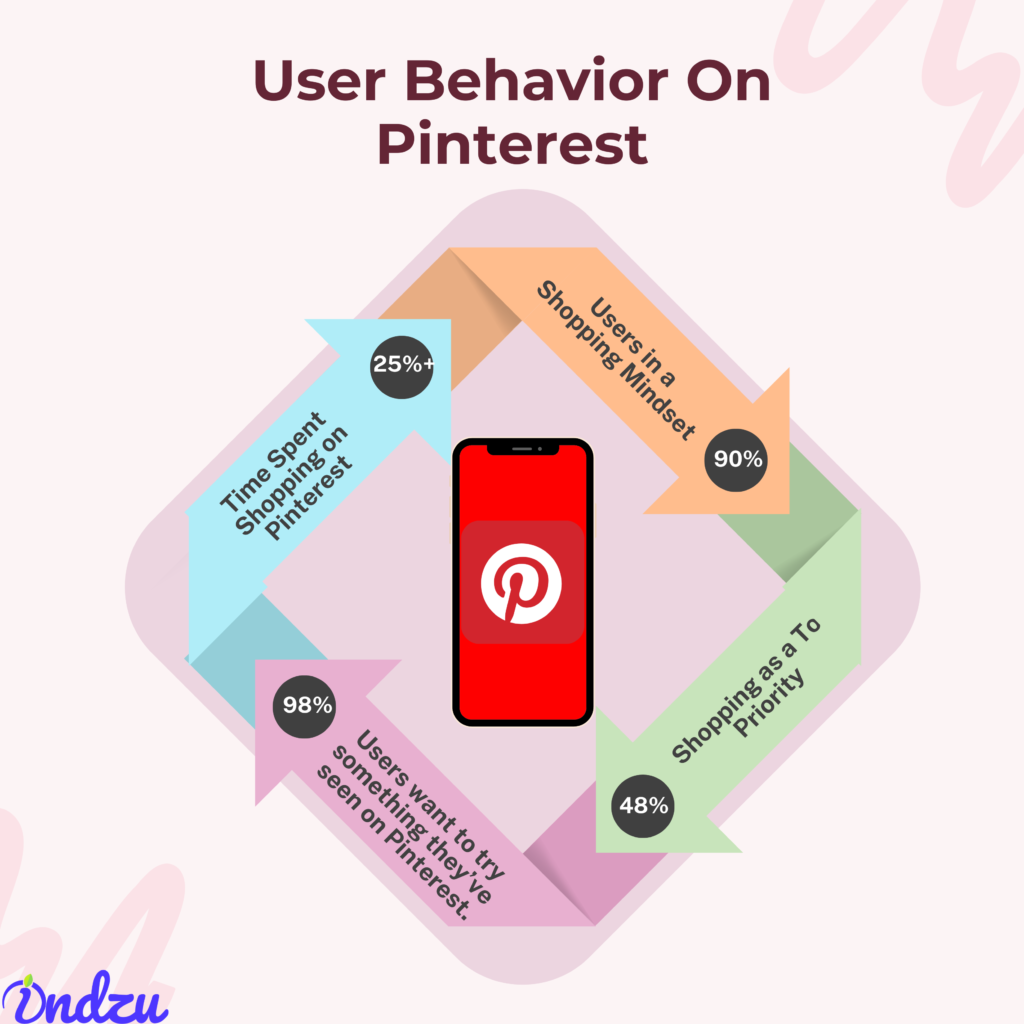
90 % of people have shopping mindset on Pinterest.
| Users in a Shopping Mindset | 90% |
| Shopping as a Top Priority | 48% of Users |
| Users want to try something they’ve seen on Pinterest. | 98% |
| Time Spent Shopping on Pinterest | 25%+ |
Trends on Pinterest sustain 20% longer.
Pinterest Ads are 2.3 times cheaper than other platforms.
61% of Pinterest users have purchased something after seeing sponsored Pins.
This table shows how Pinterest can influence purchase decisions.
| US Consumers Making Purchases Based on Pinterest Recommendations | 47% |
| Consumers Using Pinterest to Purchase Products (2023) | 23% (US) |
| Global Social Shoppers Using Pinterest | 14% (both male and female) |
| Millennials Using Pinterest to Purchase | 16% |
| Gen Z Using Pinterest to Purchase | 13% |
| Gen X Using Pinterest to Purchase | 13% |
The number of searches made by Gen-Zs has increased by 31%
As of November 2024, Pinterest had approximately 11K employees across six continents.
Pinterest set a record as the quickest site to attract 10 million unique monthly visitors148. More than 200 million audience can be reached via Pinterest Ads.
Brands who use catalogs on Pinterest, get 2x return on Ad spend.
Pinterest has 23.2% year-on-year growth in terms of strong audience growth.
TikTok
TikTok was launched in 2017; it is just 7 years old. ByteDance owns it.
There are 1.925 billion TikTok users worldwide. There are 170 million monthly active users in the USA.
Asia Pacific and MENA (Latin America and the Middle East and North Africa) regions have the highest number of TikTok users.
Indonesia and the U.S.A. have the highest user base in TikTok.
| Rank (as of July 2024) | Country | TikTok Users (in millions) |
| 1 | Indonesia | 157.6 |
| 2 | United States | 120.5 |
In 2024, People spent almost 58 minutes (on average) on TikTok.
| Year | Average daily time spent on TikTok | Change over the previous year |
| 2024 | 58 minutes, 24 seconds | ↑ 3 minutes, 36 seconds |
More men are active on TikTok than women.
| Gender | Percentage of Users |
| Women | 45.2% |
| Men | 54.8% |
The age bracket of 18-24 is most active on TikTok.
| Age Group | Proportion of TikTok Users |
| 18-24 years | 34.8% |
| 25-34 years | 34.0% |
Reasons for using TikTok
| Activity |
| Following or researching brands/products |
| Keeping up with news and current events |
| Posting or sharing photos/videos |
| Messaging friends and family |
A business posts 1 or 2 times/ week on TikTok (on average)
| Rank | Industry | Median Engagement Rate (%) |
| 1 | Higher Education | 16.26% |
| 2 | Sports Teams | 9.18% |
| 3 | Travel | 7.43% |
TikTok has the highest engagement rate of 2.65% among all social media platforms
In 2023, TikTok was the 11th most used social media platform.
TikTok is the 1st non-gaming platform to generate $10 billion from consumer spending(In 2023)
In 2023, TikTok generated 16.1 billion revenue
TikTok is the 1st non-game and non-meta app to reach 3 Billion downloads
TikTok For Business And Marketing
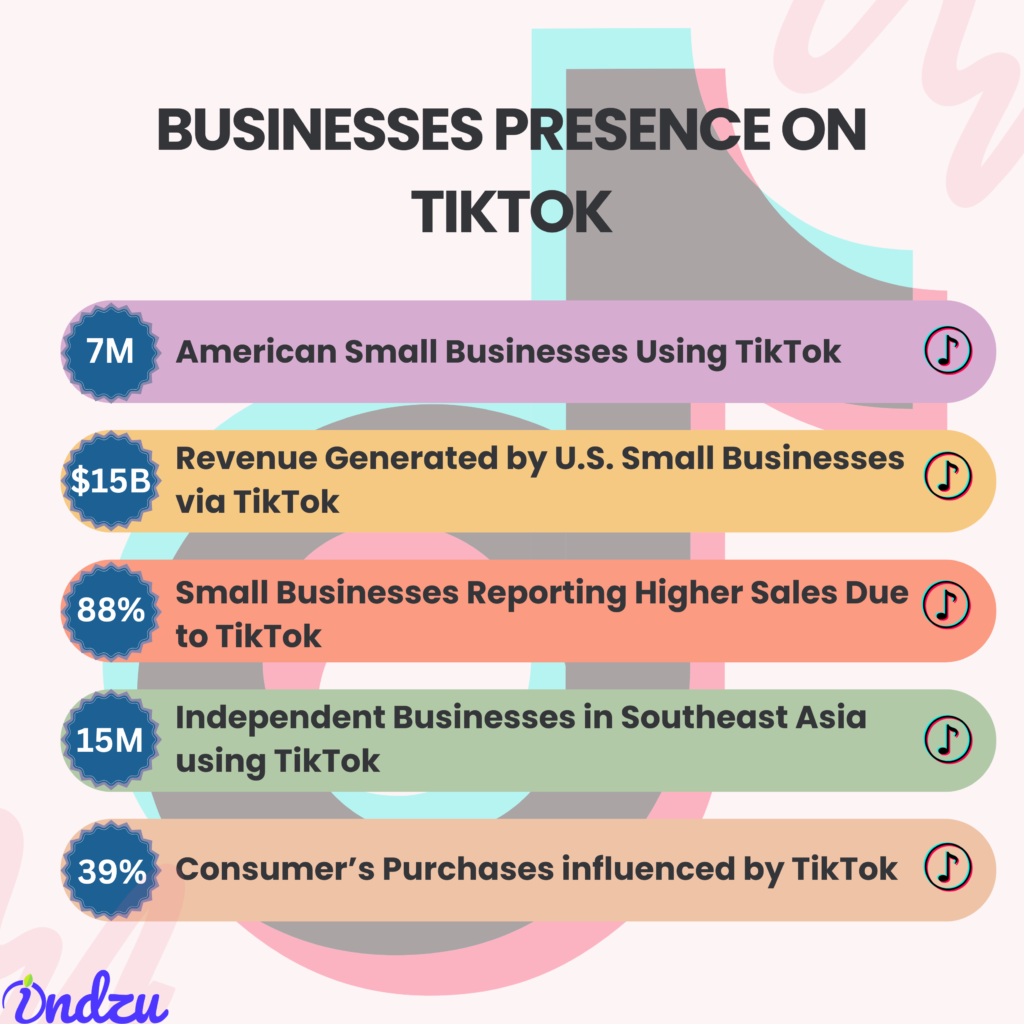
Many small businesses in the USA and Southeast Asia use TikTok for their business.
| American Small Businesses Using TikTok | 7M |
| Revenue Generated by U.S. Small Businesses via TikTok | $15B |
| Small Businesses Reporting Higher Sales Due to TikTok | 88% |
| Independent Businesses in Southeast Asia using TikTok(2023) | 15M |
TikTok Ads can reach 13.6% of the world’s population and 53.9% of the U.S.A.’s adult population.
| TikTok’s Ad Reach (Global) | 13.6% of the world’s population |
| TikTok Reaches U.S. Adults | 53.9% |
TikTok influences the purchase decisions of consumers.
| Purchases influenced by TikTok | 39% of consumers |
| Users who purchased after watching TikTok LIVE | 50% of consumers |
| Users are more likely to discover a new brand/product from celebrities/public figures | 50% more likely |
67% of women rely on creator recommendations on TikTok before making a purchase.
An influencer presence in a TikTok video ad boosts the Ad view rate by 193%
TikTok users have the highest rate of Impulse Buying
68% of Gen-Z adults in the U.S.A. are willing to purchase on TikTok.
TikTok For Influencers
There are 1.1 million influencers on TikTok (as of March 2024)
Top 25% of U.S. adults on TikTok produce 98 % of videos on TikTok
28% Percent of U.S. creators who selected TikTok as their favorite platform
26% of U.S creators earn highly on TikTok.
In Jan 2024, TikTok had 7000 employees in the USA.
How People Interact on Each Social Media Platform
Which is the most downloaded social media app?
TikTok is the most downloaded app worldwide
Worldwide Downloads Ranking (2023)
| Rank | Platform |
| 1 | TikTok |
| 2 | |
| 3 | |
| 4 | YouTube |
| 5 | Disney+ |
Which is the most downloaded app in the U.S.A.?
In 2023, Instagram was the most downloaded app in the U.S.A
| Platform | Downloads (Millions) |
| 166 | |
| 141 | |
| TikTok | 137 |
| 115 | |
| Telegram | 79 |
Which is the fastest-growing app in terms of downloads?
Threads, the fastest-growing app in history, garnered 100 million downloads in just five days.
What are the top 3 social media platforms in which users spend the maximum amount of time?
| 1. TikTok |
| 2. YouTube |
| 3. Facebook |
According to marketers, which are the best social media platforms that give the best ROI?
According to marketers, YouTube gives the best ROI.
| Platform | ROI (%) |
| YouTube | 25% |
| 22% | |
| 21% | |
| TikTok | 14% |
Which social media app was opened the maximum number of times by users?
As of July 2024, users have been able to open WhatsApp a maximum number of times.
| Rank | Platform | Average Monthly Sessions |
| 1 | 912 | |
| 2 | 348 | |
| 3 | Line | 327 |
| 4 | TikTok | 311 |
| 5 | 31 |
On which social media platform the average time spent per session is more?
People spend more time on each session on YouTube.
| Platform | Avg Time Per Session | App Opens Per Month |
| YouTube | 7 min 25 sec | N/A |
| TikTok | 5 min 56 sec | N/A |
| 3 min 42 sec | N/A | |
| 2 min 44 sec | 348 |
Which social media platform had the maximum Ad- reach?
Facebook had the maximum Ad reach.
| Rank | Platform | Potential Ad Reach (Billion) |
| 1 | 2.24 | |
| 2 | YouTube | 2.17 |
| 3 | TikTok | 1.60 |
| 4 | 1.60 | |
| 5 | 1.10 |
According to creators, which social media platform was the most effective?
YouTube was the most preferred platform for creators
| Rank | Platform | Effectiveness for Selling Products & Services (%) |
| 1 | YouTube | 26% |
| 2 | Other Platforms | 24% |
| 3 | 23% | |
| 4 | TikTok | 19% |
According to social shoppers, which was the most preferred social media platform?
Facebook gives the best shopping experience to shoppers
| Rank | Platform | Best Shopping Experience (%) |
| 1 | 23% | |
| 2 | 19% | |
| 3 | TikTok | 13% |
| 4 | 7% | |
| 5 | YouTube | 7% |
Which social media app have consumers spent the maximum cumulative amount of money on?
From 2013-2023, consumers have spent maximum on TikTok.
Top Apps by Cumulative Consumer Spend Over Time (2013-2023):
| Rank | App | Cumulative Consumer Spend |
| 1 | TikTok | ~$11B |
| 2 | Tinder | ~$9B |
| 3 | YouTube | ~$8B |
| 4 | Disney+ | ~$5B |
| 5 | Tencent Video | ~$4B |
According to 45% of Gen-Zs, which social media platform can influence their purchasing decisions?
In 2023, TikTok & Instagram could influence the purchasing decisions of Gen-Zs.
| Rank | Platform | Influence on Purchase Decisions (2023) |
| 1 | TikTok & Instagram | 51% |
| 2 | YouTube | 38% |
| 3 | 24% | |
| 4 | Snapchat | 17% |
| 5 | 14% |
Which social media platform has the highest number of active users?
Facebook is the largest social media platform. It has the highest number of monthly active users.
| Social Media | Users in 2025(Monthly Active Users) |
| 3.05 billion | |
| YouTube | 2.70 Billion |
| TikTok | 1.925 billion |
| 1.40 billion | |
| 1.15 Billion | |
| 537 million |
Which age group is most active on social media in the U.S.A.?
In the U.S.A., those aged 35-44 years use social media the most.
| Age Group | Number of social media users in U.S.A (Million) |
| 35-44 years | 40.9 |
| 18-24 years | 29.1 |
| 45-54 years | 33.9 |
| 55-64 years | 28.3 |
| 65+ years | 29.9 |
(Source-ignitesocialmedia)
Which gender uses social media the most?
| Platform | Mostly loved by |
| Male Users | |
| Male Users | |
| YouTube | Males Users |
| Males Users | |
| Female Users | |
| TikTok | Male Users |
Which Countries and Regions Use Social Media the Most?
| Social Media | Region | Country (Highest Users) |
| Southern Asia, North America | India, United States | |
| Asia-Pacific, Europe | India, United States | |
| YouTube | Southern Asia, Southeast Asia | India, United States |
| North America, South America | United States, India | |
| North America, South America | United States, Brazil | |
| TikTok | Asia-Pacific, MENA (Middle East & North Africa) | Indonesia, United States |
What Is Hot, And Working Now?
What kind of content do people prefer?
Any relatable content that provides value that is useful or enhances the user’s life in any way is preferable. People love this kind of content.
How is AI used in Social Media?
People use AI to optimize, automate, analyze, and enhance the social media game. It can be writing captions and hashtags or creating the whole content itself with AI.
Can we create content via AI?
Yes, it is definitely essential to use AI while creating content, as it speeds up the process and makes the work easier. However, entirely relying on AI will cause the audience to lose connection. In the era where content is available in plenty, audiences search for connection and a personal touch. There should be a balance between using AI and having originality.
There are plenty of AI tools available in the market; there are examples where 90% of social media is handled with AI, with minimal human intervention.
What kind of content format is preferred by people?
- Short-form content is becoming more popular in these times. TikTok, Instagram Reels, and YouTube Shorts are examples of how short-form content is liked and shared so rapidly.
- Interactive content makes the audience participate and draws reactions from the audience.
- Even though short-form videos are popular, long-form content formats like podcasts and webinars are popular among audiences as they can provide deeper insights into a topic and are also made in an easy-to-consume format.
- When content is expressed funnily and cleverly, like memes or in a lighthearted way, then it becomes easier for people to consume.
Why are brands focusing on posting stories often?
Since stories only last for 24 hours, there is curiosity within the audience, and the engagement rate is higher. Also, people post events from the current day or fresh events in stories. Both consuming and posting stories are easy. More and more brands are now focusing on stories.
(Source- adstrategic, brandmentions)
What Is Stored In The Future?
Authentic content and user-generated content are going to get more value. People love genuineness, and hence, the authentic hooks that make people feel connected are going to get more attention than the traditional hooks.
Platforms like TikTok and YouTube are encouraging creators to make long-form content. That makes people stay on a social media platform longer, and that is the main objective of social media platforms now. Longer format content is going to be back in the race soon.
With the help of AI, more businesses and creators would enter the social media world. Therefore, creativity is going to be valued more and more
All the social media platforms are going to push social commerce. TikTok and Instagram have already been doing wonders in the field of social commerce, and very soon, other platforms will encourage social commerce, too.
It is projected that social media users are going to grow year after year.
| YEAR | TOTAL SOCIAL MEDIA USERS |
| 2025 | 5.20 Billion |
| 2026 (expected) | 5.65 Billion |
| 2027 (expected) | 5.85 Billion |
| 2028 (expected) | 6.05 Billion |
Key takeaway
Social media is vast, and it is going to get bigger. A mere presence on social media is not going to help any business or creator; rather, managing your social media properly and connecting with the audience should be the main focus.
Share this article


Recent Articles
 Social
How to set up a Facebook business page
Suppose you are following our blogs. You must have already known that Facebook is the...
August 21, 2025 Social
300 + Trending Instagram Hashtags for Every Niche (2025 Edition)
Instagram itself reports that it has discovered more than 79% of the posts through hashtags....
August 20, 2025 Social
January social media post ideas
Christmas is just over, the new year has arrived, and come on, these days do...
August 14, 2025 Social
101 October Social Media Post Ideas
101 October social media post ideas!!! The month is frenetic in the most perfect way....
August 13, 2025 Social
50+ December Social Media Post Ideas
December is a month filled with gratitude, celebrations, and much more. Do you know what...
August 8, 2025 Social
TOP 20 BLUESKY STATISTICS
Have you ever seen a social media platform create its rival? This sounds very dramatic,...
August 8, 2025 Social
The Evolution of Social Media: Then vs. Now
Do you often wonder how people lived earlier without phones or the Internet? Would you...
August 8, 2025 Social
50+ Inspirational Instagram Quotes to Boost Your Feed
If you visit a place that is stylish, clean, sassy, and gives you positive vibes....
August 7, 2025 Social
X (Twitter) Statistics for 2025: top 65 statistics for X(Twitter)
You want to know all the hot and important updates of the world, but at...
August 7, 2025 Social
20 Social Media Post Ideas that Always Work
And Guess What? It’s that time again. Your content brain has hit the wall, and...
August 5, 2025 Social
The Social Media Psychology Behind Clicks
How do you get people to click? What is the psychology behind social media? How...
August 5, 2025 Social
Social Media Trends That Will Rule in 2026
Change is the only trend that stays. “Last Week Tonight with John Oliver” aired a...
August 5, 2025 Social
30 Small Business Marketing Ideas to Boost Sales During Slow months
Every small business goes through slow business months. Those quiet stretches waver motivation, customer traffic...
August 4, 2025 Social
How the Instagram Algorithm Works in 2025
Everything was going fine; Instagram was going well, and you were getting significant growth, and...
August 4, 2025 Social
The Ultimate Twitter Image Size Guide for 2025
You noticed a very important political view, and you wanted to make it clear by...
August 4, 2025 Social
Instagram AI Caption Generator: Is It Worth the Hype in 2025?
Every word matters – especially on Instagram. A caption isn’t just a piece of text;...
July 17, 2025 Social
What is a spam account on social media and how to spot one?
When the digital arena has advanced so much, connecting with anyone around the world is...
July 15, 2025 Social
Instagram Highlights: A Step-by-Step Guide
Here is the best way to keep your stories for more than 24 hours. Explore...
July 15, 2025 Social
What Is Social Media Management A Beginner’s Guide
Are you feeling exhausted by doing multiple logins and logouts to manage your social media...
July 12, 2025 Social
How to make an Instagram Story poll?
Want more engagement on your Instagram story in just one tap? You can create Instagram...
July 11, 2025 Social
5 Things You Didn’t Know A Social Media Tool Could Do
91% of entrepreneurs and businesses use social media for marketing to build their brand and...
July 11, 2025 Social
Social listening – What is it and Why it matters in 2025?
If you casually search for some space-saving furniture on a social media platform one fine...
July 9, 2025 Social
Why Most Social Media Management Tools Get Social Media Analytics Wrong – And How to Fix It
Why do most Social Media tools get Social Media Analytics wrong? Simple – they report...
July 8, 2025 Social
How Much Does YouTube Pay for 1 Million Views?
We often see people earning highly from YouTube. YouTubers boast high-end interiors, costly cars, and...
July 3, 2025 Social
How to delete a comment on Instagram?
Did your friend roast you under one of your Instagram posts? That’s what friends do:...
June 25, 2025 Social
How to delete Instagram account?
You want to stay away from Instagram and delete your account. Or you always think...
June 23, 2025 Social
How to clear Instagram cache?
Is your Instagram slowing down, or are you experiencing a glitch? Learn how to clearInstagram...
June 18, 2025 Social
Why can’t I follow people on Instagram?
Everything is just going fine. You gain some new friends on Instagram. This feels so...
June 16, 2025 Social
How to turn off Meta AI on Instagram
Meta AI was launched on Instagram in April 2024. When many people found it amazing...
June 12, 2025 Social
Best Instagram Reel length for Maximum Engagement
Instagram Reels have become a cornerstone of content marketing on the platform. This blog explores...
June 9, 2025 Social
How many Instagram accounts can I have?
Do you want to have another Instagram account? Do you feel it’s necessary to have...
June 3, 2025 Social
Tips for Evaluating Social Media Tools During Free Trials
4.89 billion people are using social media across the globe and nearly every individual is...
June 2, 2025 Social
Does Facebook notify when you screenshot a story?
Wondering does Facebook notify when you screenshot a story? The simple answer is no. Facebook...
June 2, 2025 Social
What is the meaning of Instagram user?
Just yesterday, you saw the real user’s name in the DM section, and now you...
May 31, 2025 Social
Why can’t I add music to my Instagram post?
Music is a game changer in content; music can direct our mood and enter directly...
May 28, 2025 Social
What is Quiet Mode On Instagram?
Is there any way you can be on Instagram but not be there at the...
May 22, 2025 Social
What are Impressions on LinkedIn?
Are you posting on LinkedIn to gain more reach and popularity? While you are posting,...
May 13, 2025 Social
Is LinkedIn Premium worth it?
If you see your friend subscribing to LinkedIn Premium and wonder if you could manage...
May 13, 2025 Social
How to change an Instagram password?
Did your friend find out your Instagram password? Here’s how to change an Instagram password...
May 13, 2025 Social
How to get more followers on Instagram?
Done everything? Have you tried all the hacks? Posted all kinds of content? Improved content...
May 12, 2025 Social
How to see if someone unfollowed you on Instagram?
Just some days before, you saw many followers on Instagram, but now you see that...
May 7, 2025 Social
How to block someone on LinkedIn?
Some people do not understand the value of your time; they will constantly send irrelevant...
May 7, 2025 Social
How to download Instagram videos?
You just saw an Instagram reel using the Insta app, and now you want to...
May 6, 2025 Social
Instagram Video Length: Let Us Debug How long can a video be on Instagram?
You saw others posting long videos on Instagram and thought you could do the same,...
May 2, 2025 Social
How to change your name on Instagram
Want to rebrand your Instagram? Learn how to change your name on Instagram! Instagram is...
May 1, 2025 Social
How do you tag someone on Instagram?
You came across relatable content on Instagram, and you want to tag your bestie, but...
April 30, 2025 Social
How to see who shared your Instagram post.
Did you see your post on someone else story and wonder how to see who...
April 29, 2025 Social
21 Interesting Stats you need to know about YouTube
Are you a business, looking to grow on YouTube? Or are you a content creator,...
March 17, 2025 Social
TikTok by the Numbers: Must-Know Stats to Dominate in 2025
Most Important TikTok Stats: TikTok is a social media platform that revolutionized social media platforms....
March 12, 2025 Social
19 Most Important Pinterest Statistics
Many users think that Pinterest is a search engine or the hub for new ideas...
March 12, 2025 Social
What Does Restricting Someone on Instagram Do?
It is a beautiful day, and you want to spend your energy on positive things....
March 11, 2025 Social
How to see and recover deleted messages on Instagram?
You were doing something, and Instagram messages got deleted mistakenly, or you were just in...
March 11, 2025 Social
How to hide followers on Instagram
A lot of your friends, relatives, or colleagues are likely on Instagram. However, you might...
March 11, 2025 Social
22 interesting stats about LinkedIn
Interesting LinkedIn stats: Are you planning to use LinkedIn for your business? Do you wish...
March 11, 2025 Social
How to Change Background Color on Instagram Story
You may not be able to change your life overnight, but at least you can...
March 11, 2025 Social
Essential Instagram Stats You Need to Know in 2025
Do you think of purchasing something and search for it on Instagram before purchasing? Instagram’s...
March 11, 2025 Social
18 Interesting Google My Business Stats 2025
The journey of Google My Business started in 2004 when Google started listing local businesses....
March 10, 2025 Social
Interesting Facebook Stats- You Can’t Ignore in 2025
No one needs an introduction to Facebook, but many people would be surprised to know...
March 10, 2025 Social
Does instagram notify screenshots when you screenshot a story, post, or direct message?
Have you ever wondered does instagram notify screenshots when you screenshot a story, post, or...
March 9, 2025 Social
Can you see who views your Instagram profile, story, and post?
Getting curious about how can you see who views your Instagram profile, story, and post....
March 8, 2025