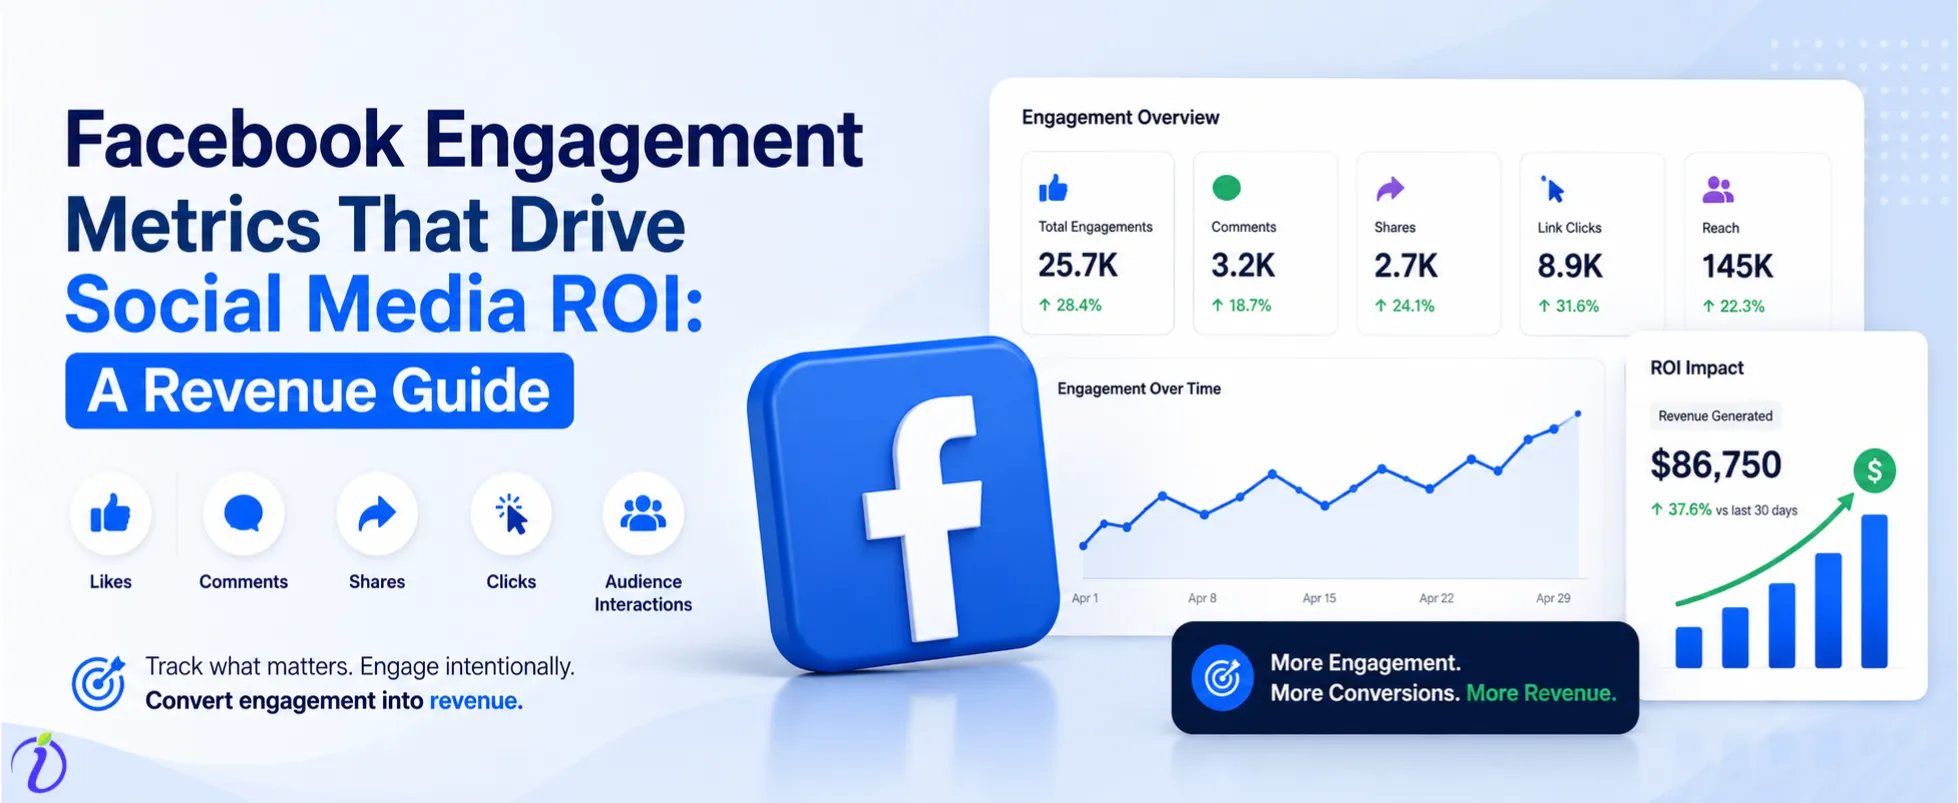
What are the actual Facebook Engagement Metrics that drive social media ROI? If this question comes to mind, it’s obvious that we often see brands and creators celebrate milestones like gaining followers, rising likes, and increasing shares. Still, these numbers do not always showcase the real growth that generates revenue. 70% of users use Facebook daily, and about 40% try to generate revenue from the platform.
Understanding which Facebook Engagement Metric actually increases return on Investment (ROI) is essential to designing an effective social media strategy. In this blog, we will break down the key Facebook engagement metric that truly affects the ROI.
 Time killer · Pain
Spending 6 hours writing posts that get zero traction?
Paste your URL. ZuAI turns it into 30 brand-on captions in 10 minutes — no blank-page panic, no generic AI filler.
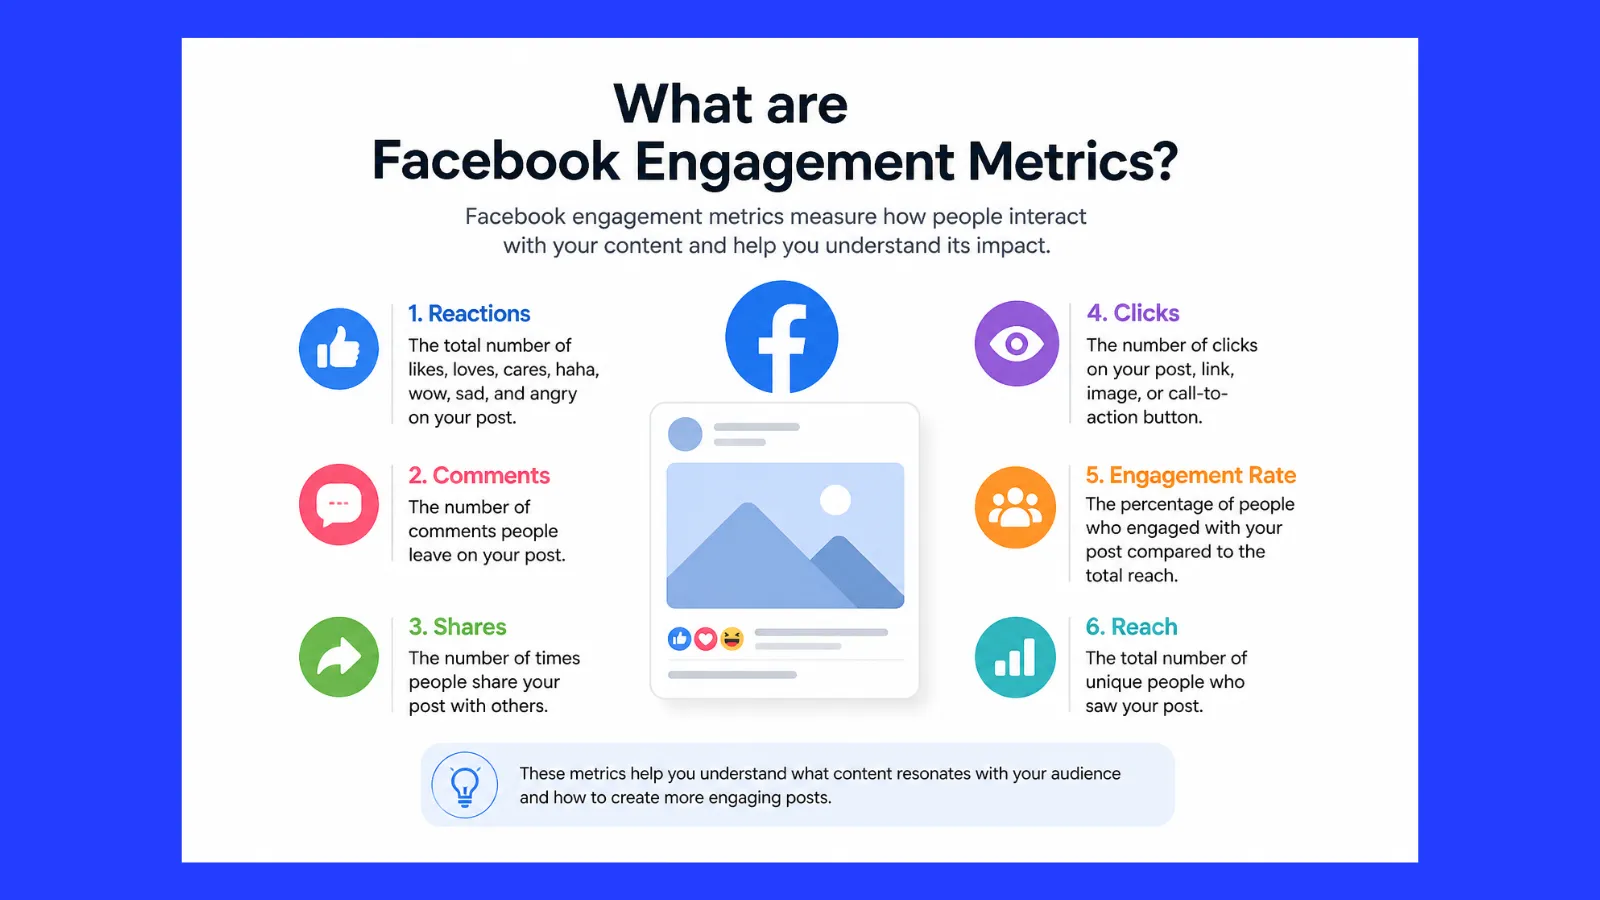
What are Facebook engagement metrics?
To put it simply, Facebook engagement metrics are the data that show how audiences interact with your content on Facebook. Or, to specify, you may ask whether audiences are only viewing your content and leaving, or actually engaging with it through likes, comments, and shares.
Outcome · RecommendedGet 30 days of social content from your website — in 10 minutes.
What is social media ROI?
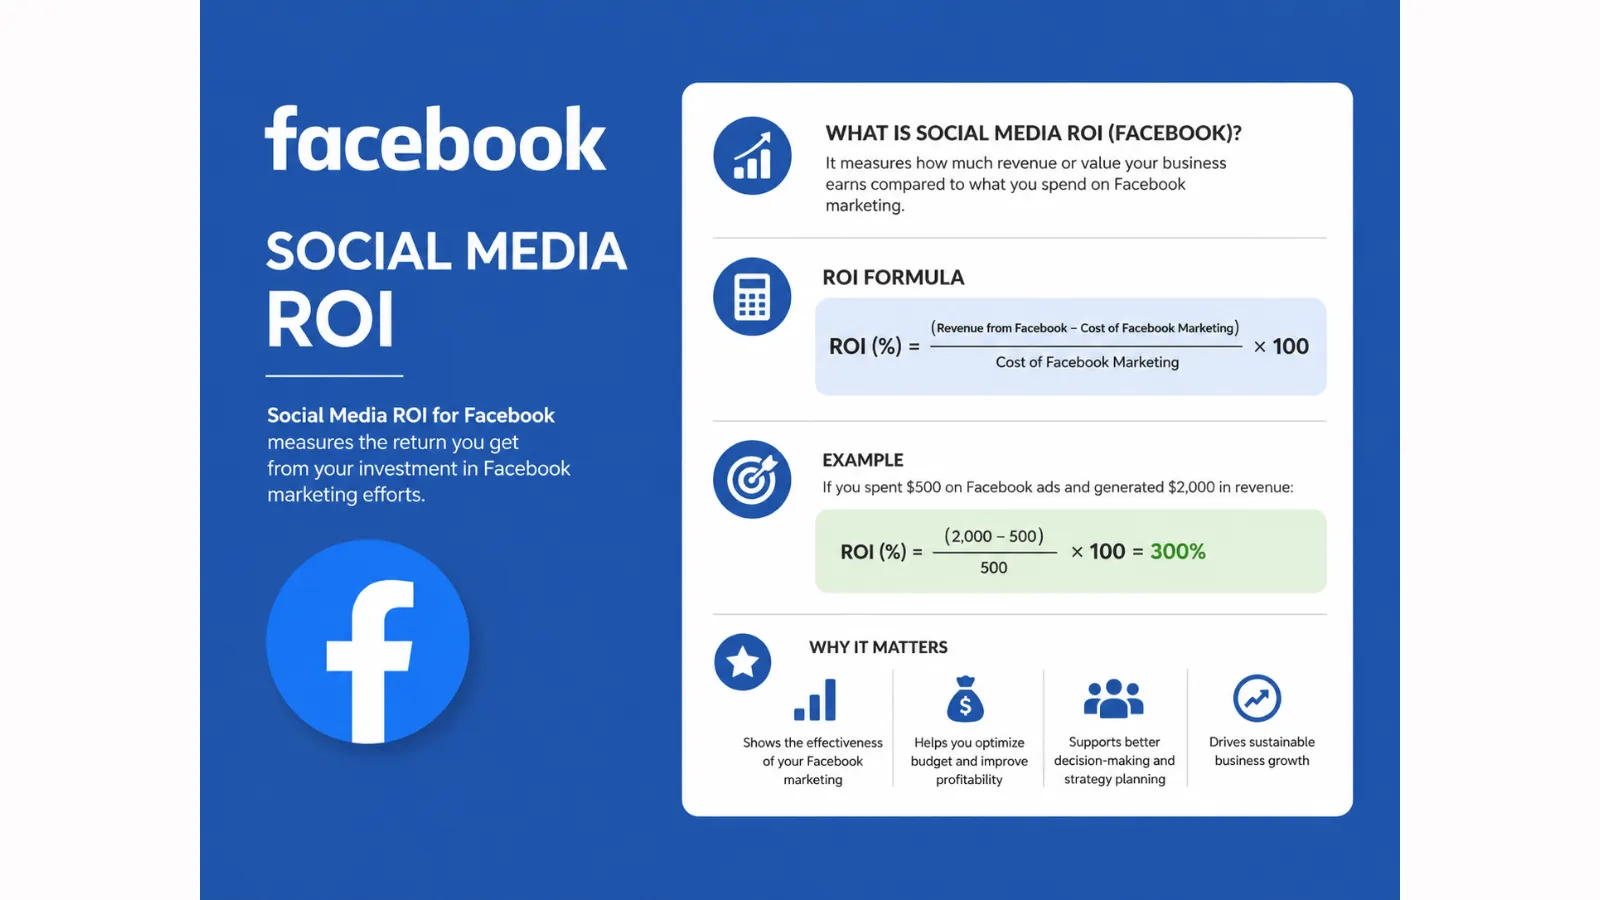
Return on Investment (ROI) is a measure of how much return you get from your social media investment, based on the effort, hard work, time, and money you spend on your content.
Basic formula
ROI = (Return- Investment)/ Investment x 100
For example, if you spend 4000 on Content creation, you generate $8,000 in sales.
So, ROI is = (8000-4000)/4000×100 = 100%
What counts as engagement metrics?
Engage metrics are measurable actions the audience performs to interact with your content. To put it simply, Facebook engagement metrics provide insight into how the audience responded to a piece of content.
- Like
A simple like can indicate that viewers are liking your content, or when you see an increase in likes of certain content, that definitely indicates people just do not see your content, they interact with it.
- Comments
When viewers comment on your content, they share their opinions, indicating they are engaging with it more deeply.
- Shares
Generally, when a viewer shares content, it means the content is worth sharing with their private networks and simply answers a viewer’s queries. Simply put, this is a strong indicator of reaching and getting more views.
- Saves
When a viewer saves your content, that means they will use it later, which signifies your content is valuable and relevant.
- Clicks
When a viewer visits your profile and clicks on one of your posts, if they find it valuable, they will definitely click on your content more often. This increase in clicks indicates greater engagement.
- Watch time
When a viewer completes 80% of a video, that shows a higher completion rate. And a higher completion rate means more watch time.
- Follow
When a viewer decides to follow your channel after seeing your content.
- Engagement Rate
Your overall engagement rate is calculated by analyzing the above-mentioned criteria and provides an overview of how viewers interact with your content.
Proof · Verified
2k+ grew faster with one tool.
Vanity Metrics vs ROI-Driven Metrics
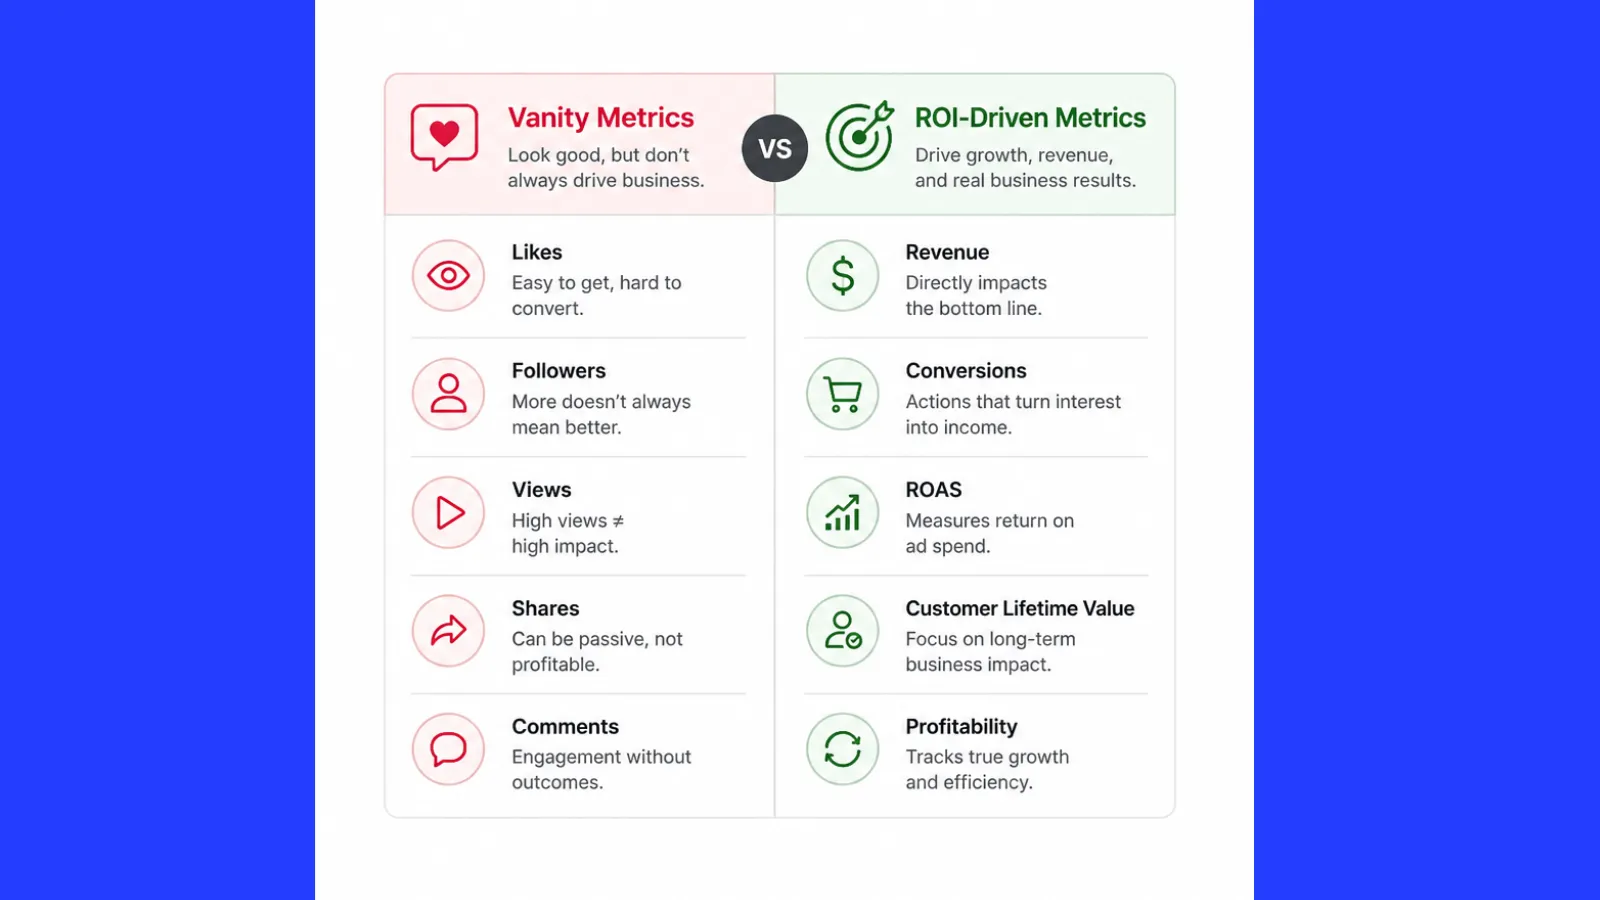
Vanity metrics are those that actually focus on popularity, are easy to measure, and look good in reports.
For example: likes, shares, followers.
And ROI-Driven metrics are those which focus on the profit, comparatively harder to measure, but help you to reach the real result of your content that emphasises profitability, not just activity.
For example- conversion rate, sales, ROI.
Vanity metrics
Vanity metrics are primary indicators of engagement that help measure popularity, but don’t clarify the real impact on your goals.
- Likes,
- Follower count,
- Video views.
For example, if your content gets 1 million views and 10,000 likes, this will simply indicate how popular it is online.
Revenue-driven metrics
Revenue-driven metrics track how effectively your content increases sales, profits, and delivers customer satisfaction.
- Link clicks
- Conversions
- Leads generated
- Messages/ Inquiries
- Sales
Free · Instant · No signupSee what ZuAI generates from your website — right now.
Paste your URL. Watch ZuAI write a month of brand-on captions in seconds. Preview before you create an account.
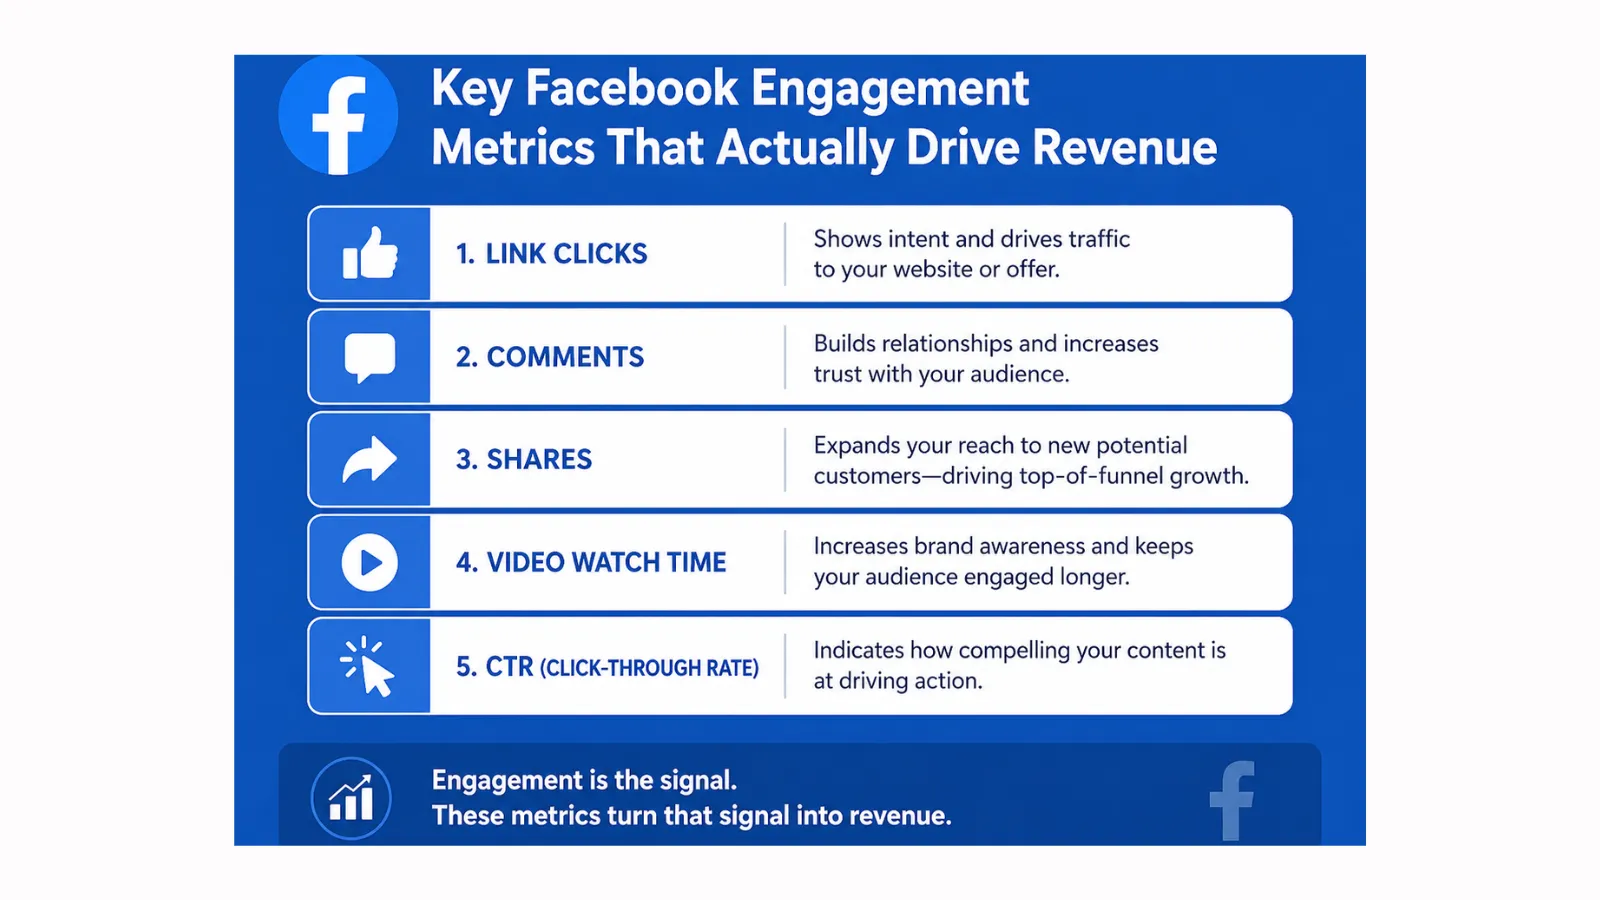
Key Facebook Engagement Metrics That Actually Drive Revenue
- Click-Through-Rate (CTR)
A higher Click-Through-Rate indicates that more viewers are attracted to your content. If you want to increase sales, you can’t ignore the click-through rate. A higher CTR signals that your headline, Thumbnail, and call to action are working well, indicating a higher chance of conversion.
- Conversion Rate
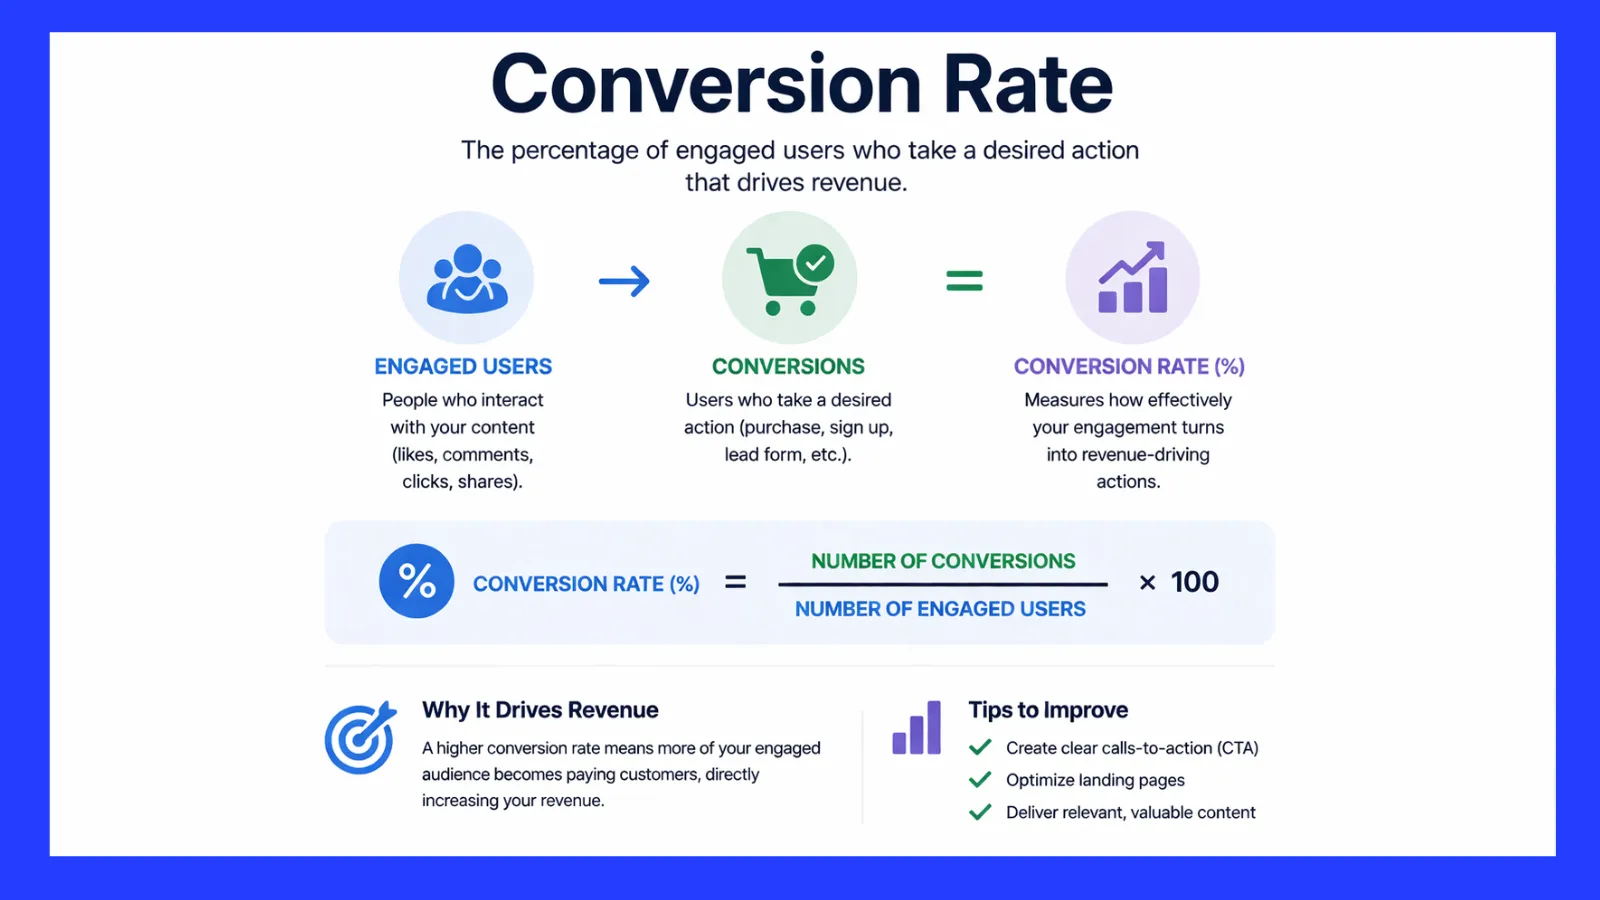
Conversion Rate is the rate at which viewers take action after visiting your content, ad, or website.
For example, when 1000 people see your product and 100 people purchase your product, then the conversion rate is 100/1000×100 = 10%
- Cost Per Click ( CPC)
Cost per Click is how much you are willing to pay for each sale. The thing to remember here is that the lower your CPC, the higher your profit may be. To reduce costs and maximize profits, you may try different creative approaches and target different audiences.
- Leads Generated
Leads generated are the total number of people who show interest in your product through messages. If you interact with them directly, they can be your potential customer. You may use automated and quick replies to their queries using a sandbox.
- Retargeting Engagement
It is often easier to interact with happy customers of your product and service. You offer them discounts or the option to repurchase your services. In this way, you can enhance your sales.
- Return on Ad Spends (ROAS)
Return on ad spend means the revenue you earn from spending on an ad. When you showcase your product through a paid ad and earn from the product, that is your return on ad spend.
For example, you spend Rs.500 on ads and earn Rs.2000; your return on ads (ROAS) is 4x.
Speed · 10-minute setupOne coffee from URL to a full month of scheduled posts.
Drop your URL, brew your coffee, come back to 30 brand-on captions ready to publish.
How to track these metrics effectively?
It is essential to track Facebook engagement metrics. Since the data is not all in one place, you need to follow engagement patterns, viewer behaviour, and total revenue. Here’s how to track these metrics.
Use Facebook Ads Manager as your main dashboard
You can use Facebook Ads Manager to track the metrics such as
- CTR,
- Cost per click,
- Conversions,
- Return on Ad Spend.
Install Meta Pixel on your website
When you use the Facebook platform to sell your services without Meta Pixel, you cannot track engagement, purchases, or sales. With the help of Meta Pixel, you can track
- Purchases,
- Add-to-cart actions,
- Page views,
- Checkout behaviour.
Connect with Google Analytics
If you want more insight beyond Facebook, then you should connect with Google Analytics. IT provides you heavy insights on
- Traffic and performance,
- User demographics, views, impressions and ROI,
- Conversion path.
Blank tab. Six open browsers. No clue what to post.

 After · With Indzu
Paste one URL. Get 30 scheduled posts.
Strategies to Improve ROI-Driven Engagement
To improve ROI- driven engagement on Facebook, you should focus on-
- Optimizing your content for conversion, not just engagement.
- You may create “intent-driven” For example, focus on Product demos, before-and-after results, customer testimonials, promotions, and offers.
- You may use retargeting strategy to attract previous customers, for example, add to cart users, video viewers, and website visitors.
Time killer · Pain
Spending 6 hours writing posts that get zero traction?
Paste your URL. ZuAI turns it into 30 brand-on captions in 10 minutes — no blank-page panic, no generic AI filler.
FAQ Section
Q1. What are Facebook Engagement Metrics?
Answer: Facebook engagement metrics measure how viewers interact with certain content through clicks, likes, shares, comments, and conversions. For ROI, you have to focus on actions that help grow sales and earn profit.
Q2. Why are likes and shares less important to drive actual revenue?
Answer: Likes and shares help to increase reach and visibility, but they don’t always lead to purchase. So, they do not drive actual revenue.
Q3. What is a good conversion rate for Facebook ads?
Answer: A good conversion rate for Facebook ads
Conversion rate | impact |
2% -5% | Solid / average |
5%-10% | Strong performance |
| 10%+ | Excellent |